Honduran vs Immigrants from Japan Master's Degree

COMPARE

Honduran
Race
Ancestry
AfghanAfricanAlaska NativeAlaskan AthabascanAlbanianAleutAlsatianAmericanApacheArabArapahoArgentineanArmenianAssyrian/Chaldean/SyriacAustralianAustrianBahamianBangladeshiBarbadianBasqueBelgianBelizeanBermudanBhutaneseBlackfeetBolivianBrazilianBritishBritish West IndianBulgarianBurmeseCajunCambodianCanadianCape VerdeanCarpatho RusynCelticCentral AmericanCentral American IndianCherokeeCheyenneChickasawChileanChineseChippewaChoctawColombianColvilleComancheCosta RicanCreeCreekCroatianCrowCubanCypriotCzechCzechoslovakianDanishDelawareDominicanDutchDutch West IndianEastern EuropeanEcuadorianEgyptianEnglishEstonianEthiopianEuropeanFijianFilipinoFinnishFrenchFrench American IndianFrench CanadianGermanGerman RussianGhanaianGreekGuamanian/ChamorroGuatemalanGuyaneseHaitianHmongHonduranHopiHoumaHungarianIcelanderIndian (Asian)IndonesianInupiatIranianIraqiIrishIroquoisIsraeliItalianJamaicanJapaneseJordanianKenyanKiowaKoreanLaotianLatvianLebaneseLiberianLithuanianLumbeeLuxembourgerMacedonianMalaysianMalteseMarshalleseMenomineeMexicanMexican American IndianMongolianMoroccanNative HawaiianNavajoNepaleseNew ZealanderNicaraguanNigerianNorthern EuropeanNorwegianOkinawanOsageOttawaPaiutePakistaniPalestinianPanamanianParaguayanPennsylvania GermanPeruvianPimaPolishPortuguesePotawatomiPuebloPuerto RicanPuget Sound SalishRomanianRussianSalvadoranSamoanScandinavianScotch-IrishScottishSeminoleSenegaleseSerbianShoshoneSierra LeoneanSiouxSlavicSlovakSloveneSomaliSouth AfricanSouth AmericanSouth American IndianSoviet UnionSpaniardSpanishSpanish AmericanSpanish American IndianSri LankanSubsaharan AfricanSudaneseSwedishSwissSyrianTaiwaneseThaiTlingit-HaidaTohono O'OdhamTonganTrinidadian and TobagonianTsimshianTurkishU.S. Virgin IslanderUgandanUkrainianUruguayanUteVenezuelanVietnameseWelshWest IndianYakamaYaquiYugoslavianYumanYup'ikZimbabwean
Immigration
NonimmigrantsImmigrantsAfghanistanAfricaAlbaniaArgentinaArmeniaAsiaAustraliaAustriaBahamasBangladeshBarbadosBelarusBelgiumBelizeBoliviaBosnia and HerzegovinaBrazilBulgariaBurma/MyanmarCabo VerdeCambodiaCameroonCanadaCaribbeanCentral AmericaChileChinaColombiaCongoCosta RicaCroatiaCubaCzechoslovakiaDenmarkDominicaDominican RepublicEastern AfricaEastern AsiaEastern EuropeEcuadorEgyptEl SalvadorEnglandEritreaEthiopiaEuropeFijiFranceGermanyGhanaGreeceGrenadaGuatemalaGuyanaHaitiHondurasHong KongHungaryIndiaIndonesiaIranIraqIrelandIsraelItalyJamaicaJordanKazakhstanKenyaKoreaKuwaitLaosLatin AmericaLatviaLebanonLiberiaLithuaniaMalaysiaMexicoMicronesiaMiddle AfricaMoldovaMoroccoNepalNetherlandsNicaraguaNigeriaNorth AmericaNorth MacedoniaNorthern AfricaNorthern EuropeNorwayOceaniaPakistanPanamaPeruPhilippinesPolandPortugalRomaniaRussiaSaudi ArabiaScotlandSenegalSerbiaSierra LeoneSingaporeSomaliaSouth AfricaSouth AmericaSouth Central AsiaSouth Eastern AsiaSouthern EuropeSpainSri LankaSt. Vincent and the GrenadinesSudanSwedenSwitzerlandSyriaTaiwanThailandTrinidad and TobagoTurkeyUgandaUkraineUruguayUzbekistanVenezuelaVietnamWest IndiesWestern AfricaWestern AsiaWestern EuropeYemenZaireZimbabweAzores
Immigrants from Japan
Race
Ancestry
AfghanAfricanAlaska NativeAlaskan AthabascanAlbanianAleutAlsatianAmericanApacheArabArapahoArgentineanArmenianAssyrian/Chaldean/SyriacAustralianAustrianBahamianBangladeshiBarbadianBasqueBelgianBelizeanBermudanBhutaneseBlackfeetBolivianBrazilianBritishBritish West IndianBulgarianBurmeseCajunCambodianCanadianCape VerdeanCarpatho RusynCelticCentral AmericanCentral American IndianCherokeeCheyenneChickasawChileanChineseChippewaChoctawColombianColvilleComancheCosta RicanCreeCreekCroatianCrowCubanCypriotCzechCzechoslovakianDanishDelawareDominicanDutchDutch West IndianEastern EuropeanEcuadorianEgyptianEnglishEstonianEthiopianEuropeanFijianFilipinoFinnishFrenchFrench American IndianFrench CanadianGermanGerman RussianGhanaianGreekGuamanian/ChamorroGuatemalanGuyaneseHaitianHmongHopiHoumaHungarianIcelanderIndian (Asian)IndonesianInupiatIranianIraqiIrishIroquoisIsraeliItalianJamaicanJapaneseJordanianKenyanKiowaKoreanLaotianLatvianLebaneseLiberianLithuanianLumbeeLuxembourgerMacedonianMalaysianMalteseMarshalleseMenomineeMexicanMexican American IndianMongolianMoroccanNative HawaiianNavajoNepaleseNew ZealanderNicaraguanNigerianNorthern EuropeanNorwegianOkinawanOsageOttawaPaiutePakistaniPalestinianPanamanianParaguayanPennsylvania GermanPeruvianPimaPolishPortuguesePotawatomiPuebloPuerto RicanPuget Sound SalishRomanianRussianSalvadoranSamoanScandinavianScotch-IrishScottishSeminoleSenegaleseSerbianShoshoneSierra LeoneanSiouxSlavicSlovakSloveneSomaliSouth AfricanSouth AmericanSouth American IndianSoviet UnionSpaniardSpanishSpanish AmericanSpanish American IndianSri LankanSubsaharan AfricanSudaneseSwedishSwissSyrianTaiwaneseThaiTlingit-HaidaTohono O'OdhamTonganTrinidadian and TobagonianTsimshianTurkishU.S. Virgin IslanderUgandanUkrainianUruguayanUteVenezuelanVietnameseWelshWest IndianYakamaYaquiYugoslavianYumanYup'ikZimbabwean
Immigration
NonimmigrantsImmigrantsAfghanistanAfricaAlbaniaArgentinaArmeniaAsiaAustraliaAustriaBahamasBangladeshBarbadosBelarusBelgiumBelizeBoliviaBosnia and HerzegovinaBrazilBulgariaBurma/MyanmarCabo VerdeCambodiaCameroonCanadaCaribbeanCentral AmericaChileChinaColombiaCongoCosta RicaCroatiaCubaCzechoslovakiaDenmarkDominicaDominican RepublicEastern AfricaEastern AsiaEastern EuropeEcuadorEgyptEl SalvadorEnglandEritreaEthiopiaEuropeFijiFranceGermanyGhanaGreeceGrenadaGuatemalaGuyanaHaitiHondurasHong KongHungaryIndiaIndonesiaIranIraqIrelandIsraelItalyJamaicaJapanJordanKazakhstanKenyaKoreaKuwaitLaosLatin AmericaLatviaLebanonLiberiaLithuaniaMalaysiaMexicoMicronesiaMiddle AfricaMoldovaMoroccoNepalNetherlandsNicaraguaNigeriaNorth AmericaNorth MacedoniaNorthern AfricaNorthern EuropeNorwayOceaniaPakistanPanamaPeruPhilippinesPolandPortugalRomaniaRussiaSaudi ArabiaScotlandSenegalSerbiaSierra LeoneSingaporeSomaliaSouth AfricaSouth AmericaSouth Central AsiaSouth Eastern AsiaSouthern EuropeSpainSri LankaSt. Vincent and the GrenadinesSudanSwedenSwitzerlandSyriaTaiwanThailandTrinidad and TobagoTurkeyUgandaUkraineUruguayUzbekistanVenezuelaVietnamWest IndiesWestern AfricaWestern AsiaWestern EuropeYemenZaireZimbabweAzores
Master's Degree
Income
Poverty
Unemployment
Labor Participation
Family Structure
Vehicle Availability
Education Level
Disability

Master's Degree Comparison

Hondurans

Immigrants from Japan

Tragic
Exceptional
11.9%
MASTER'S DEGREE
0.2/ 100
METRIC RATING
283rd/ 347
METRIC RANK
20.0%
MASTER'S DEGREE
100.0/ 100
METRIC RATING
25th/ 347
METRIC RANK

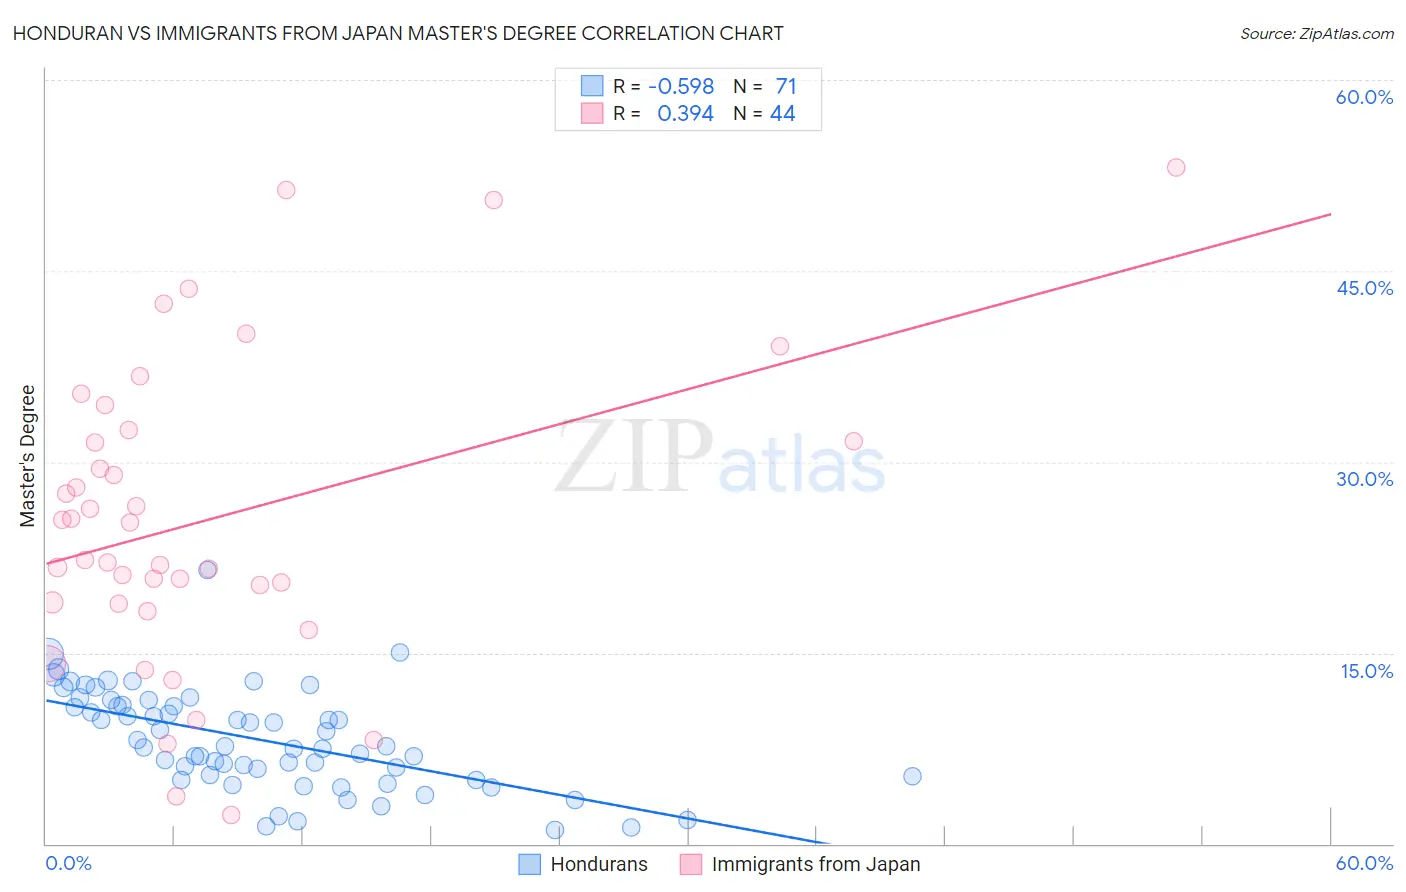
Honduran vs Immigrants from Japan Master's Degree Correlation Chart

The statistical analysis conducted on geographies consisting of 357,698,981 people shows a substantial negative correlation between the proportion of Hondurans and percentage of population with at least master's degree education in the United States with a correlation coefficient (R) of -0.598 and weighted average of 11.9%. Similarly, the statistical analysis conducted on geographies consisting of 340,075,167 people shows a mild positive correlation between the proportion of Immigrants from Japan and percentage of population with at least master's degree education in the United States with a correlation coefficient (R) of 0.394 and weighted average of 20.0%, a difference of 67.5%.
Honduran vs Immigrants from Japan Master's Degree

Master's Degree Correlation Summary

MeasurementHonduranImmigrants from Japan
Minimum1.1%2.2%
Maximum21.5%53.1%
Range20.4%50.9%
Mean8.2%25.5%
Median7.6%23.8%
Interquartile 25% (IQ1)5.3%18.9%
Interquartile 75% (IQ3)10.9%32.1%
Interquartile Range (IQR)5.6%13.2%
Standard Deviation (Sample)3.9%12.0%
Standard Deviation (Population)3.9%11.9%

Similar Demographics by Master's Degree

Demographics Similar to Hondurans by Master's Degree

In terms of master's degree, the demographic groups most similar to Hondurans are Immigrants from El Salvador (12.0%, a difference of 0.41%), Malaysian (12.0%, a difference of 0.72%), Ottawa (11.9%, a difference of 0.72%), Immigrants from Dominican Republic (12.1%, a difference of 0.85%), and Immigrants from Belize (12.1%, a difference of 0.90%).
DemographicsRating | RankMaster's Degree
Blacks/African Americans
0.3
/100
|
#276
Tragic
12.1%
Immigrants | Caribbean
0.3
/100
|
#277
Tragic
12.1%
Potawatomi
0.3
/100
|
#278
Tragic
12.1%
Immigrants | Belize
0.2
/100
|
#279
Tragic
12.1%
Immigrants | Dominican Republic
0.2
/100
|
#280
Tragic
12.1%
Malaysians
0.2
/100
|
#281
Tragic
12.0%
Immigrants | El Salvador
0.2
/100
|
#282
Tragic
12.0%
Hondurans
0.2
/100
|
#283
Tragic
11.9%
Ottawa
0.2
/100
|
#284
Tragic
11.9%
Immigrants | Nicaragua
0.2
/100
|
#285
Tragic
11.8%
Aleuts
0.1
/100
|
#286
Tragic
11.8%
Immigrants | Haiti
0.1
/100
|
#287
Tragic
11.8%
Immigrants | Honduras
0.1
/100
|
#288
Tragic
11.8%
Guatemalans
0.1
/100
|
#289
Tragic
11.7%
Ute
0.1
/100
|
#290
Tragic
11.7%

Demographics Similar to Immigrants from Japan by Master's Degree

In terms of master's degree, the demographic groups most similar to Immigrants from Japan are Cambodian (20.0%, a difference of 0.10%), Immigrants from Sri Lanka (19.9%, a difference of 0.51%), Turkish (19.9%, a difference of 0.58%), Latvian (19.8%, a difference of 0.99%), and Immigrants from Sweden (20.3%, a difference of 1.3%).
DemographicsRating | RankMaster's Degree
Soviet Union
100.0
/100
|
#18
Exceptional
20.5%
Immigrants | Hong Kong
100.0
/100
|
#19
Exceptional
20.5%
Indians (Asian)
100.0
/100
|
#20
Exceptional
20.5%
Immigrants | Ireland
100.0
/100
|
#21
Exceptional
20.4%
Israelis
100.0
/100
|
#22
Exceptional
20.3%
Immigrants | France
100.0
/100
|
#23
Exceptional
20.3%
Immigrants | Sweden
100.0
/100
|
#24
Exceptional
20.3%
Immigrants | Japan
100.0
/100
|
#25
Exceptional
20.0%
Cambodians
100.0
/100
|
#26
Exceptional
20.0%
Immigrants | Sri Lanka
100.0
/100
|
#27
Exceptional
19.9%
Turks
100.0
/100
|
#28
Exceptional
19.9%
Latvians
100.0
/100
|
#29
Exceptional
19.8%
Immigrants | Turkey
100.0
/100
|
#30
Exceptional
19.7%
Immigrants | Korea
100.0
/100
|
#31
Exceptional
19.7%
Burmese
100.0
/100
|
#32
Exceptional
19.7%