Guamanian/Chamorro vs Immigrants from Portugal Professional Degree

COMPARE

Guamanian/Chamorro
Race
Ancestry
AfghanAfricanAlaska NativeAlaskan AthabascanAlbanianAleutAlsatianAmericanApacheArabArapahoArgentineanArmenianAssyrian/Chaldean/SyriacAustralianAustrianBahamianBangladeshiBarbadianBasqueBelgianBelizeanBermudanBhutaneseBlackfeetBolivianBrazilianBritishBritish West IndianBulgarianBurmeseCajunCambodianCanadianCape VerdeanCarpatho RusynCelticCentral AmericanCentral American IndianCherokeeCheyenneChickasawChileanChineseChippewaChoctawColombianColvilleComancheCosta RicanCreeCreekCroatianCrowCubanCypriotCzechCzechoslovakianDanishDelawareDominicanDutchDutch West IndianEastern EuropeanEcuadorianEgyptianEnglishEstonianEthiopianEuropeanFijianFilipinoFinnishFrenchFrench American IndianFrench CanadianGermanGerman RussianGhanaianGreekGuamanian/ChamorroGuatemalanGuyaneseHaitianHmongHonduranHopiHoumaHungarianIcelanderIndian (Asian)IndonesianInupiatIranianIraqiIrishIroquoisIsraeliItalianJamaicanJapaneseJordanianKenyanKiowaKoreanLaotianLatvianLebaneseLiberianLithuanianLumbeeLuxembourgerMacedonianMalaysianMalteseMarshalleseMenomineeMexicanMexican American IndianMongolianMoroccanNative HawaiianNavajoNepaleseNew ZealanderNicaraguanNigerianNorthern EuropeanNorwegianOkinawanOsageOttawaPaiutePakistaniPalestinianPanamanianParaguayanPennsylvania GermanPeruvianPimaPolishPortuguesePotawatomiPuebloPuerto RicanPuget Sound SalishRomanianRussianSalvadoranSamoanScandinavianScotch-IrishScottishSeminoleSenegaleseSerbianShoshoneSierra LeoneanSiouxSlavicSlovakSloveneSomaliSouth AfricanSouth AmericanSouth American IndianSoviet UnionSpaniardSpanishSpanish AmericanSpanish American IndianSri LankanSubsaharan AfricanSudaneseSwedishSwissSyrianTaiwaneseThaiTlingit-HaidaTohono O'OdhamTonganTrinidadian and TobagonianTsimshianTurkishU.S. Virgin IslanderUgandanUkrainianUruguayanUteVenezuelanVietnameseWelshWest IndianYakamaYaquiYugoslavianYumanYup'ikZimbabwean
Immigration
NonimmigrantsImmigrantsAfghanistanAfricaAlbaniaArgentinaArmeniaAsiaAustraliaAustriaBahamasBangladeshBarbadosBelarusBelgiumBelizeBoliviaBosnia and HerzegovinaBrazilBulgariaBurma/MyanmarCabo VerdeCambodiaCameroonCanadaCaribbeanCentral AmericaChileChinaColombiaCongoCosta RicaCroatiaCubaCzechoslovakiaDenmarkDominicaDominican RepublicEastern AfricaEastern AsiaEastern EuropeEcuadorEgyptEl SalvadorEnglandEritreaEthiopiaEuropeFijiFranceGermanyGhanaGreeceGrenadaGuatemalaGuyanaHaitiHondurasHong KongHungaryIndiaIndonesiaIranIraqIrelandIsraelItalyJamaicaJapanJordanKazakhstanKenyaKoreaKuwaitLaosLatin AmericaLatviaLebanonLiberiaLithuaniaMalaysiaMexicoMicronesiaMiddle AfricaMoldovaMoroccoNepalNetherlandsNicaraguaNigeriaNorth AmericaNorth MacedoniaNorthern AfricaNorthern EuropeNorwayOceaniaPakistanPanamaPeruPhilippinesPolandRomaniaRussiaSaudi ArabiaScotlandSenegalSerbiaSierra LeoneSingaporeSomaliaSouth AfricaSouth AmericaSouth Central AsiaSouth Eastern AsiaSouthern EuropeSpainSri LankaSt. Vincent and the GrenadinesSudanSwedenSwitzerlandSyriaTaiwanThailandTrinidad and TobagoTurkeyUgandaUkraineUruguayUzbekistanVenezuelaVietnamWest IndiesWestern AfricaWestern AsiaWestern EuropeYemenZaireZimbabweAzores
Immigrants from Portugal
Race
Ancestry
AfghanAfricanAlaska NativeAlaskan AthabascanAlbanianAleutAlsatianAmericanApacheArabArapahoArgentineanArmenianAssyrian/Chaldean/SyriacAustralianAustrianBahamianBangladeshiBarbadianBasqueBelgianBelizeanBermudanBhutaneseBlackfeetBolivianBrazilianBritishBritish West IndianBulgarianBurmeseCajunCambodianCanadianCape VerdeanCarpatho RusynCelticCentral AmericanCentral American IndianCherokeeCheyenneChickasawChileanChineseChippewaChoctawColombianColvilleComancheCosta RicanCreeCreekCroatianCrowCubanCypriotCzechCzechoslovakianDanishDelawareDominicanDutchDutch West IndianEastern EuropeanEcuadorianEgyptianEnglishEstonianEthiopianEuropeanFijianFilipinoFinnishFrenchFrench American IndianFrench CanadianGermanGerman RussianGhanaianGreekGuatemalanGuyaneseHaitianHmongHonduranHopiHoumaHungarianIcelanderIndian (Asian)IndonesianInupiatIranianIraqiIrishIroquoisIsraeliItalianJamaicanJapaneseJordanianKenyanKiowaKoreanLaotianLatvianLebaneseLiberianLithuanianLumbeeLuxembourgerMacedonianMalaysianMalteseMarshalleseMenomineeMexicanMexican American IndianMongolianMoroccanNative HawaiianNavajoNepaleseNew ZealanderNicaraguanNigerianNorthern EuropeanNorwegianOkinawanOsageOttawaPaiutePakistaniPalestinianPanamanianParaguayanPennsylvania GermanPeruvianPimaPolishPortuguesePotawatomiPuebloPuerto RicanPuget Sound SalishRomanianRussianSalvadoranSamoanScandinavianScotch-IrishScottishSeminoleSenegaleseSerbianShoshoneSierra LeoneanSiouxSlavicSlovakSloveneSomaliSouth AfricanSouth AmericanSouth American IndianSoviet UnionSpaniardSpanishSpanish AmericanSpanish American IndianSri LankanSubsaharan AfricanSudaneseSwedishSwissSyrianTaiwaneseThaiTlingit-HaidaTohono O'OdhamTonganTrinidadian and TobagonianTsimshianTurkishU.S. Virgin IslanderUgandanUkrainianUruguayanUteVenezuelanVietnameseWelshWest IndianYakamaYaquiYugoslavianYumanYup'ikZimbabwean
Immigration
NonimmigrantsImmigrantsAfghanistanAfricaAlbaniaArgentinaArmeniaAsiaAustraliaAustriaBahamasBangladeshBarbadosBelarusBelgiumBelizeBoliviaBosnia and HerzegovinaBrazilBulgariaBurma/MyanmarCabo VerdeCambodiaCameroonCanadaCaribbeanCentral AmericaChileChinaColombiaCongoCosta RicaCroatiaCubaCzechoslovakiaDenmarkDominicaDominican RepublicEastern AfricaEastern AsiaEastern EuropeEcuadorEgyptEl SalvadorEnglandEritreaEthiopiaEuropeFijiFranceGermanyGhanaGreeceGrenadaGuatemalaGuyanaHaitiHondurasHong KongHungaryIndiaIndonesiaIranIraqIrelandIsraelItalyJamaicaJapanJordanKazakhstanKenyaKoreaKuwaitLaosLatin AmericaLatviaLebanonLiberiaLithuaniaMalaysiaMexicoMicronesiaMiddle AfricaMoldovaMoroccoNepalNetherlandsNicaraguaNigeriaNorth AmericaNorth MacedoniaNorthern AfricaNorthern EuropeNorwayOceaniaPakistanPanamaPeruPhilippinesPolandPortugalRomaniaRussiaSaudi ArabiaScotlandSenegalSerbiaSierra LeoneSingaporeSomaliaSouth AfricaSouth AmericaSouth Central AsiaSouth Eastern AsiaSouthern EuropeSpainSri LankaSt. Vincent and the GrenadinesSudanSwedenSwitzerlandSyriaTaiwanThailandTrinidad and TobagoTurkeyUgandaUkraineUruguayUzbekistanVenezuelaVietnamWest IndiesWestern AfricaWestern AsiaWestern EuropeYemenZaireZimbabweAzores
Professional Degree
Income
Poverty
Unemployment
Labor Participation
Family Structure
Vehicle Availability
Education Level
Disability

Professional Degree Comparison

Guamanians/Chamorros

Immigrants from Portugal

Tragic
Tragic
3.8%
PROFESSIONAL DEGREE
2.2/ 100
METRIC RATING
243rd/ 347
METRIC RANK
3.5%
PROFESSIONAL DEGREE
0.5/ 100
METRIC RATING
279th/ 347
METRIC RANK

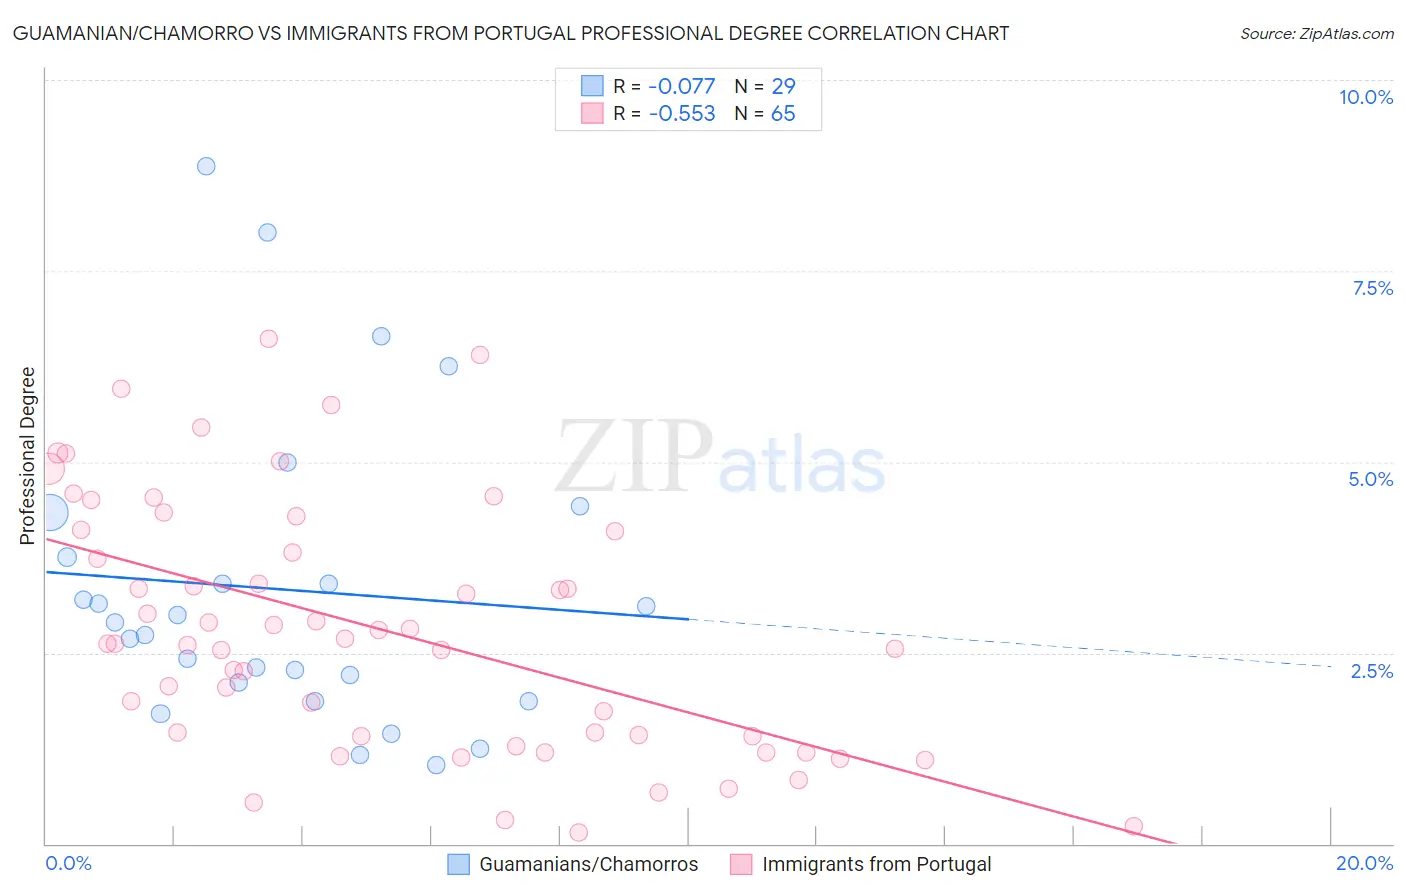
Guamanian/Chamorro vs Immigrants from Portugal Professional Degree Correlation Chart

The statistical analysis conducted on geographies consisting of 221,637,971 people shows a slight negative correlation between the proportion of Guamanians/Chamorros and percentage of population with at least professional degree education in the United States with a correlation coefficient (R) of -0.077 and weighted average of 3.8%. Similarly, the statistical analysis conducted on geographies consisting of 174,657,094 people shows a substantial negative correlation between the proportion of Immigrants from Portugal and percentage of population with at least professional degree education in the United States with a correlation coefficient (R) of -0.553 and weighted average of 3.5%, a difference of 7.2%.
Guamanian/Chamorro vs Immigrants from Portugal Professional Degree

Professional Degree Correlation Summary

MeasurementGuamanian/ChamorroImmigrants from Portugal
Minimum1.0%0.14%
Maximum8.9%6.6%
Range7.8%6.5%
Mean3.3%2.8%
Median2.9%2.6%
Interquartile 25% (IQ1)2.0%1.4%
Interquartile 75% (IQ3)4.0%4.1%
Interquartile Range (IQR)2.1%2.7%
Standard Deviation (Sample)2.0%1.6%
Standard Deviation (Population)1.9%1.6%

Similar Demographics by Professional Degree

Demographics Similar to Guamanians/Chamorros by Professional Degree

In terms of professional degree, the demographic groups most similar to Guamanians/Chamorros are Alaskan Athabascan (3.8%, a difference of 0.080%), Native Hawaiian (3.8%, a difference of 0.080%), Immigrants from Ecuador (3.8%, a difference of 0.10%), British West Indian (3.8%, a difference of 0.33%), and Immigrants from Bahamas (3.8%, a difference of 0.43%).
DemographicsRating | RankProfessional Degree
Spanish Americans
3.8
/100
|
#236
Tragic
3.9%
Immigrants | Trinidad and Tobago
3.8
/100
|
#237
Tragic
3.9%
Colville
2.6
/100
|
#238
Tragic
3.8%
British West Indians
2.4
/100
|
#239
Tragic
3.8%
Immigrants | Ecuador
2.3
/100
|
#240
Tragic
3.8%
Alaskan Athabascans
2.3
/100
|
#241
Tragic
3.8%
Native Hawaiians
2.3
/100
|
#242
Tragic
3.8%
Guamanians/Chamorros
2.2
/100
|
#243
Tragic
3.8%
Immigrants | Bahamas
2.0
/100
|
#244
Tragic
3.8%
French American Indians
1.7
/100
|
#245
Tragic
3.8%
Marshallese
1.7
/100
|
#246
Tragic
3.8%
Guyanese
1.6
/100
|
#247
Tragic
3.8%
Hmong
1.6
/100
|
#248
Tragic
3.7%
Immigrants | Grenada
1.5
/100
|
#249
Tragic
3.7%
Immigrants | Fiji
1.5
/100
|
#250
Tragic
3.7%

Demographics Similar to Immigrants from Portugal by Professional Degree

In terms of professional degree, the demographic groups most similar to Immigrants from Portugal are Japanese (3.5%, a difference of 0.040%), Dominican (3.5%, a difference of 0.040%), Apache (3.5%, a difference of 0.060%), Immigrants from Caribbean (3.5%, a difference of 0.080%), and Cheyenne (3.6%, a difference of 0.10%).
DemographicsRating | RankProfessional Degree
Immigrants | Jamaica
0.5
/100
|
#272
Tragic
3.6%
Americans
0.5
/100
|
#273
Tragic
3.6%
Potawatomi
0.5
/100
|
#274
Tragic
3.6%
Immigrants | Dominica
0.5
/100
|
#275
Tragic
3.6%
Liberians
0.5
/100
|
#276
Tragic
3.6%
Cheyenne
0.5
/100
|
#277
Tragic
3.6%
Japanese
0.5
/100
|
#278
Tragic
3.5%
Immigrants | Portugal
0.5
/100
|
#279
Tragic
3.5%
Dominicans
0.5
/100
|
#280
Tragic
3.5%
Apache
0.5
/100
|
#281
Tragic
3.5%
Immigrants | Caribbean
0.5
/100
|
#282
Tragic
3.5%
Comanche
0.4
/100
|
#283
Tragic
3.5%
Salvadorans
0.4
/100
|
#284
Tragic
3.5%
Hondurans
0.3
/100
|
#285
Tragic
3.5%
Haitians
0.3
/100
|
#286
Tragic
3.5%