Aleut vs Immigrants from Portugal Professional Degree

COMPARE

Aleut
Race
Ancestry
AfghanAfricanAlaska NativeAlaskan AthabascanAlbanianAleutAlsatianAmericanApacheArabArapahoArgentineanArmenianAssyrian/Chaldean/SyriacAustralianAustrianBahamianBangladeshiBarbadianBasqueBelgianBelizeanBermudanBhutaneseBlackfeetBolivianBrazilianBritishBritish West IndianBulgarianBurmeseCajunCambodianCanadianCape VerdeanCarpatho RusynCelticCentral AmericanCentral American IndianCherokeeCheyenneChickasawChileanChineseChippewaChoctawColombianColvilleComancheCosta RicanCreeCreekCroatianCrowCubanCypriotCzechCzechoslovakianDanishDelawareDominicanDutchDutch West IndianEastern EuropeanEcuadorianEgyptianEnglishEstonianEthiopianEuropeanFijianFilipinoFinnishFrenchFrench American IndianFrench CanadianGermanGerman RussianGhanaianGreekGuamanian/ChamorroGuatemalanGuyaneseHaitianHmongHonduranHopiHoumaHungarianIcelanderIndian (Asian)IndonesianInupiatIranianIraqiIrishIroquoisIsraeliItalianJamaicanJapaneseJordanianKenyanKiowaKoreanLaotianLatvianLebaneseLiberianLithuanianLumbeeLuxembourgerMacedonianMalaysianMalteseMarshalleseMenomineeMexicanMexican American IndianMongolianMoroccanNative HawaiianNavajoNepaleseNew ZealanderNicaraguanNigerianNorthern EuropeanNorwegianOkinawanOsageOttawaPaiutePakistaniPalestinianPanamanianParaguayanPennsylvania GermanPeruvianPimaPolishPortuguesePotawatomiPuebloPuerto RicanPuget Sound SalishRomanianRussianSalvadoranSamoanScandinavianScotch-IrishScottishSeminoleSenegaleseSerbianShoshoneSierra LeoneanSiouxSlavicSlovakSloveneSomaliSouth AfricanSouth AmericanSouth American IndianSoviet UnionSpaniardSpanishSpanish AmericanSpanish American IndianSri LankanSubsaharan AfricanSudaneseSwedishSwissSyrianTaiwaneseThaiTlingit-HaidaTohono O'OdhamTonganTrinidadian and TobagonianTsimshianTurkishU.S. Virgin IslanderUgandanUkrainianUruguayanUteVenezuelanVietnameseWelshWest IndianYakamaYaquiYugoslavianYumanYup'ikZimbabwean
Immigration
NonimmigrantsImmigrantsAfghanistanAfricaAlbaniaArgentinaArmeniaAsiaAustraliaAustriaBahamasBangladeshBarbadosBelarusBelgiumBelizeBoliviaBosnia and HerzegovinaBrazilBulgariaBurma/MyanmarCabo VerdeCambodiaCameroonCanadaCaribbeanCentral AmericaChileChinaColombiaCongoCosta RicaCroatiaCubaCzechoslovakiaDenmarkDominicaDominican RepublicEastern AfricaEastern AsiaEastern EuropeEcuadorEgyptEl SalvadorEnglandEritreaEthiopiaEuropeFijiFranceGermanyGhanaGreeceGrenadaGuatemalaGuyanaHaitiHondurasHong KongHungaryIndiaIndonesiaIranIraqIrelandIsraelItalyJamaicaJapanJordanKazakhstanKenyaKoreaKuwaitLaosLatin AmericaLatviaLebanonLiberiaLithuaniaMalaysiaMexicoMicronesiaMiddle AfricaMoldovaMoroccoNepalNetherlandsNicaraguaNigeriaNorth AmericaNorth MacedoniaNorthern AfricaNorthern EuropeNorwayOceaniaPakistanPanamaPeruPhilippinesPolandRomaniaRussiaSaudi ArabiaScotlandSenegalSerbiaSierra LeoneSingaporeSomaliaSouth AfricaSouth AmericaSouth Central AsiaSouth Eastern AsiaSouthern EuropeSpainSri LankaSt. Vincent and the GrenadinesSudanSwedenSwitzerlandSyriaTaiwanThailandTrinidad and TobagoTurkeyUgandaUkraineUruguayUzbekistanVenezuelaVietnamWest IndiesWestern AfricaWestern AsiaWestern EuropeYemenZaireZimbabweAzores
Immigrants from Portugal
Race
Ancestry
AfghanAfricanAlaska NativeAlaskan AthabascanAlbanianAlsatianAmericanApacheArabArapahoArgentineanArmenianAssyrian/Chaldean/SyriacAustralianAustrianBahamianBangladeshiBarbadianBasqueBelgianBelizeanBermudanBhutaneseBlackfeetBolivianBrazilianBritishBritish West IndianBulgarianBurmeseCajunCambodianCanadianCape VerdeanCarpatho RusynCelticCentral AmericanCentral American IndianCherokeeCheyenneChickasawChileanChineseChippewaChoctawColombianColvilleComancheCosta RicanCreeCreekCroatianCrowCubanCypriotCzechCzechoslovakianDanishDelawareDominicanDutchDutch West IndianEastern EuropeanEcuadorianEgyptianEnglishEstonianEthiopianEuropeanFijianFilipinoFinnishFrenchFrench American IndianFrench CanadianGermanGerman RussianGhanaianGreekGuamanian/ChamorroGuatemalanGuyaneseHaitianHmongHonduranHopiHoumaHungarianIcelanderIndian (Asian)IndonesianInupiatIranianIraqiIrishIroquoisIsraeliItalianJamaicanJapaneseJordanianKenyanKiowaKoreanLaotianLatvianLebaneseLiberianLithuanianLumbeeLuxembourgerMacedonianMalaysianMalteseMarshalleseMenomineeMexicanMexican American IndianMongolianMoroccanNative HawaiianNavajoNepaleseNew ZealanderNicaraguanNigerianNorthern EuropeanNorwegianOkinawanOsageOttawaPaiutePakistaniPalestinianPanamanianParaguayanPennsylvania GermanPeruvianPimaPolishPortuguesePotawatomiPuebloPuerto RicanPuget Sound SalishRomanianRussianSalvadoranSamoanScandinavianScotch-IrishScottishSeminoleSenegaleseSerbianShoshoneSierra LeoneanSiouxSlavicSlovakSloveneSomaliSouth AfricanSouth AmericanSouth American IndianSoviet UnionSpaniardSpanishSpanish AmericanSpanish American IndianSri LankanSubsaharan AfricanSudaneseSwedishSwissSyrianTaiwaneseThaiTlingit-HaidaTohono O'OdhamTonganTrinidadian and TobagonianTsimshianTurkishU.S. Virgin IslanderUgandanUkrainianUruguayanUteVenezuelanVietnameseWelshWest IndianYakamaYaquiYugoslavianYumanYup'ikZimbabwean
Immigration
NonimmigrantsImmigrantsAfghanistanAfricaAlbaniaArgentinaArmeniaAsiaAustraliaAustriaBahamasBangladeshBarbadosBelarusBelgiumBelizeBoliviaBosnia and HerzegovinaBrazilBulgariaBurma/MyanmarCabo VerdeCambodiaCameroonCanadaCaribbeanCentral AmericaChileChinaColombiaCongoCosta RicaCroatiaCubaCzechoslovakiaDenmarkDominicaDominican RepublicEastern AfricaEastern AsiaEastern EuropeEcuadorEgyptEl SalvadorEnglandEritreaEthiopiaEuropeFijiFranceGermanyGhanaGreeceGrenadaGuatemalaGuyanaHaitiHondurasHong KongHungaryIndiaIndonesiaIranIraqIrelandIsraelItalyJamaicaJapanJordanKazakhstanKenyaKoreaKuwaitLaosLatin AmericaLatviaLebanonLiberiaLithuaniaMalaysiaMexicoMicronesiaMiddle AfricaMoldovaMoroccoNepalNetherlandsNicaraguaNigeriaNorth AmericaNorth MacedoniaNorthern AfricaNorthern EuropeNorwayOceaniaPakistanPanamaPeruPhilippinesPolandPortugalRomaniaRussiaSaudi ArabiaScotlandSenegalSerbiaSierra LeoneSingaporeSomaliaSouth AfricaSouth AmericaSouth Central AsiaSouth Eastern AsiaSouthern EuropeSpainSri LankaSt. Vincent and the GrenadinesSudanSwedenSwitzerlandSyriaTaiwanThailandTrinidad and TobagoTurkeyUgandaUkraineUruguayUzbekistanVenezuelaVietnamWest IndiesWestern AfricaWestern AsiaWestern EuropeYemenZaireZimbabweAzores
Professional Degree
Income
Poverty
Unemployment
Labor Participation
Family Structure
Vehicle Availability
Education Level
Disability

Professional Degree Comparison

Aleuts

Immigrants from Portugal

Tragic
Tragic
3.6%
PROFESSIONAL DEGREE
0.7/ 100
METRIC RATING
268th/ 347
METRIC RANK
3.5%
PROFESSIONAL DEGREE
0.5/ 100
METRIC RATING
279th/ 347
METRIC RANK

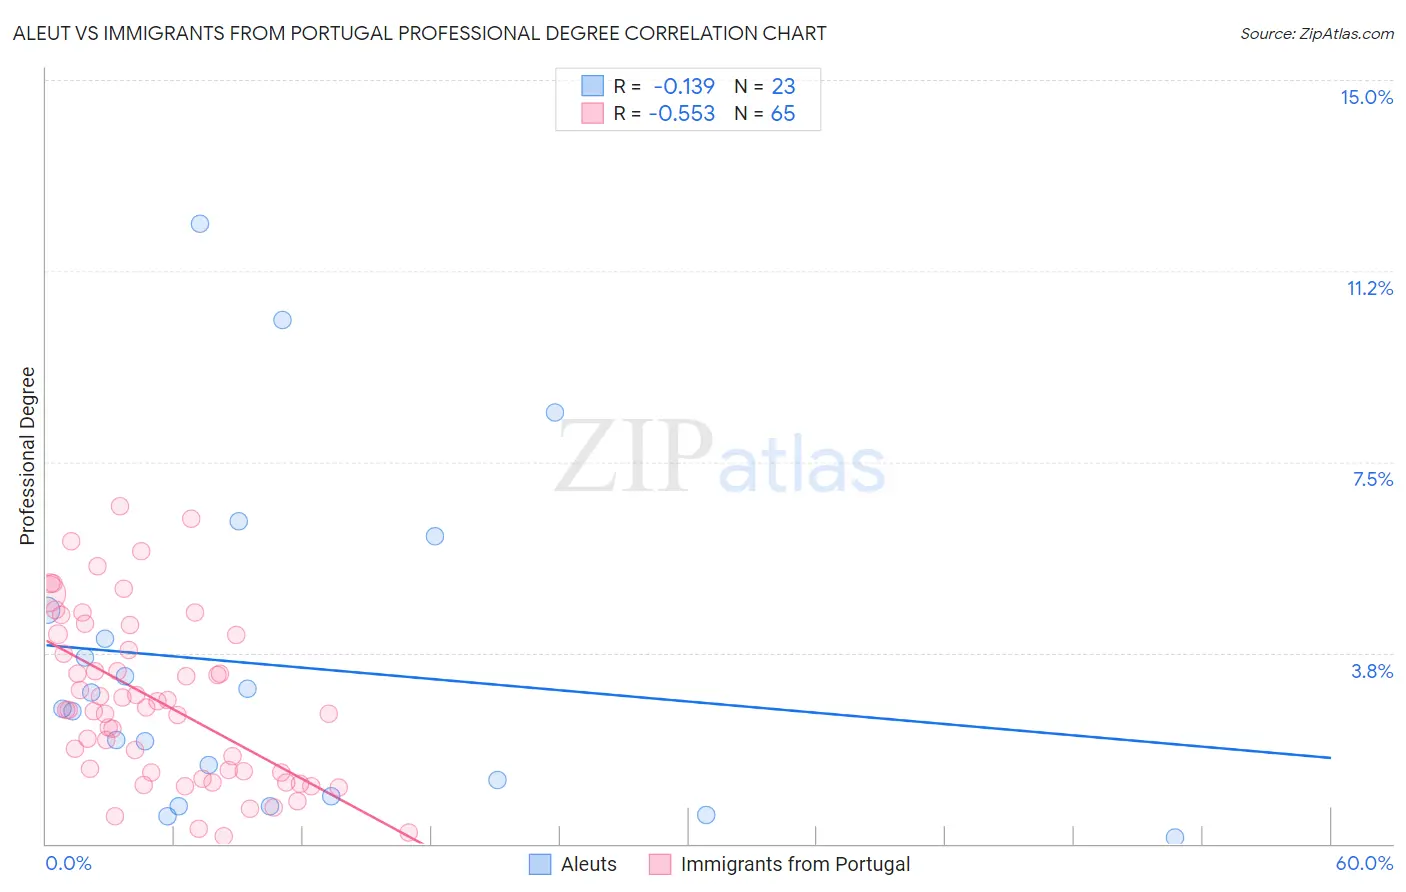
Aleut vs Immigrants from Portugal Professional Degree Correlation Chart

The statistical analysis conducted on geographies consisting of 61,685,490 people shows a poor negative correlation between the proportion of Aleuts and percentage of population with at least professional degree education in the United States with a correlation coefficient (R) of -0.139 and weighted average of 3.6%. Similarly, the statistical analysis conducted on geographies consisting of 174,657,094 people shows a substantial negative correlation between the proportion of Immigrants from Portugal and percentage of population with at least professional degree education in the United States with a correlation coefficient (R) of -0.553 and weighted average of 3.5%, a difference of 2.0%.
Aleut vs Immigrants from Portugal Professional Degree

Professional Degree Correlation Summary

MeasurementAleutImmigrants from Portugal
Minimum0.13%0.14%
Maximum12.2%6.6%
Range12.1%6.5%
Mean3.5%2.8%
Median2.6%2.6%
Interquartile 25% (IQ1)0.93%1.4%
Interquartile 75% (IQ3)4.6%4.1%
Interquartile Range (IQR)3.7%2.7%
Standard Deviation (Sample)3.2%1.6%
Standard Deviation (Population)3.1%1.6%

Demographics Similar to Aleuts and Immigrants from Portugal by Professional Degree

In terms of professional degree, the demographic groups most similar to Aleuts are Delaware (3.6%, a difference of 0.15%), Central American Indian (3.6%, a difference of 0.42%), Immigrants from Cuba (3.6%, a difference of 0.60%), Immigrants from Congo (3.6%, a difference of 0.74%), and Immigrants from Cambodia (3.6%, a difference of 0.78%). Similarly, the demographic groups most similar to Immigrants from Portugal are Japanese (3.5%, a difference of 0.040%), Dominican (3.5%, a difference of 0.040%), Apache (3.5%, a difference of 0.060%), Immigrants from Caribbean (3.5%, a difference of 0.080%), and Cheyenne (3.6%, a difference of 0.10%).
DemographicsRating | RankProfessional Degree
Hopi
0.9
/100
|
#263
Tragic
3.6%
Immigrants | Cambodia
0.9
/100
|
#264
Tragic
3.6%
Immigrants | Congo
0.8
/100
|
#265
Tragic
3.6%
Central American Indians
0.8
/100
|
#266
Tragic
3.6%
Delaware
0.7
/100
|
#267
Tragic
3.6%
Aleuts
0.7
/100
|
#268
Tragic
3.6%
Immigrants | Cuba
0.6
/100
|
#269
Tragic
3.6%
Central Americans
0.6
/100
|
#270
Tragic
3.6%
Belizeans
0.5
/100
|
#271
Tragic
3.6%
Immigrants | Jamaica
0.5
/100
|
#272
Tragic
3.6%
Americans
0.5
/100
|
#273
Tragic
3.6%
Potawatomi
0.5
/100
|
#274
Tragic
3.6%
Immigrants | Dominica
0.5
/100
|
#275
Tragic
3.6%
Liberians
0.5
/100
|
#276
Tragic
3.6%
Cheyenne
0.5
/100
|
#277
Tragic
3.6%
Japanese
0.5
/100
|
#278
Tragic
3.5%
Immigrants | Portugal
0.5
/100
|
#279
Tragic
3.5%
Dominicans
0.5
/100
|
#280
Tragic
3.5%
Apache
0.5
/100
|
#281
Tragic
3.5%
Immigrants | Caribbean
0.5
/100
|
#282
Tragic
3.5%
Comanche
0.4
/100
|
#283
Tragic
3.5%