Guamanian/Chamorro vs Immigrants from Saudi Arabia Professional Degree
COMPARE
Guamanian/Chamorro
Immigrants from Saudi Arabia
Professional Degree
Professional Degree Comparison
Guamanians/Chamorros
Immigrants from Saudi Arabia
3.8%
PROFESSIONAL DEGREE
2.2/ 100
METRIC RATING
243rd/ 347
METRIC RANK
5.9%
PROFESSIONAL DEGREE
100.0/ 100
METRIC RATING
43rd/ 347
METRIC RANK
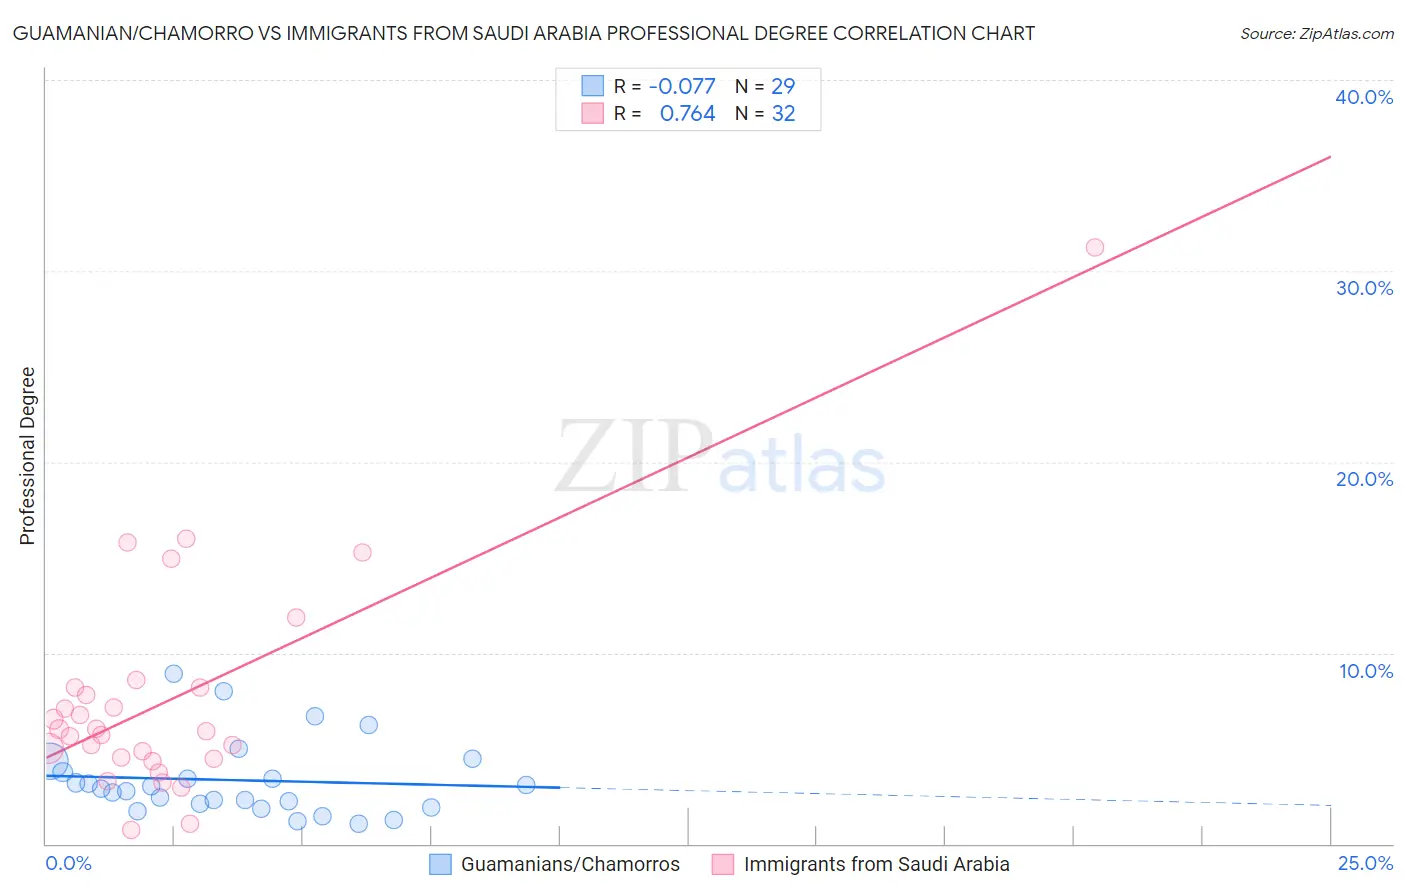
Guamanian/Chamorro vs Immigrants from Saudi Arabia Professional Degree Correlation Chart
The statistical analysis conducted on geographies consisting of 221,637,971 people shows a slight negative correlation between the proportion of Guamanians/Chamorros and percentage of population with at least professional degree education in the United States with a correlation coefficient (R) of -0.077 and weighted average of 3.8%. Similarly, the statistical analysis conducted on geographies consisting of 164,208,779 people shows a strong positive correlation between the proportion of Immigrants from Saudi Arabia and percentage of population with at least professional degree education in the United States with a correlation coefficient (R) of 0.764 and weighted average of 5.9%, a difference of 56.1%.
Professional Degree Correlation Summary
| Measurement | Guamanian/Chamorro | Immigrants from Saudi Arabia |
| Minimum | 1.0% | 0.70% |
| Maximum | 8.9% | 31.2% |
| Range | 7.8% | 30.5% |
| Mean | 3.3% | 7.6% |
| Median | 2.9% | 5.9% |
| Interquartile 25% (IQ1) | 2.0% | 4.5% |
| Interquartile 75% (IQ3) | 4.0% | 8.2% |
| Interquartile Range (IQR) | 2.1% | 3.7% |
| Standard Deviation (Sample) | 2.0% | 5.9% |
| Standard Deviation (Population) | 1.9% | 5.8% |
Similar Demographics by Professional Degree
Demographics Similar to Guamanians/Chamorros by Professional Degree
In terms of professional degree, the demographic groups most similar to Guamanians/Chamorros are Alaskan Athabascan (3.8%, a difference of 0.080%), Native Hawaiian (3.8%, a difference of 0.080%), Immigrants from Ecuador (3.8%, a difference of 0.10%), British West Indian (3.8%, a difference of 0.33%), and Immigrants from Bahamas (3.8%, a difference of 0.43%).
| Demographics | Rating | Rank | Professional Degree |
| Spanish Americans | 3.8 /100 | #236 | Tragic 3.9% |
| Immigrants | Trinidad and Tobago | 3.8 /100 | #237 | Tragic 3.9% |
| Colville | 2.6 /100 | #238 | Tragic 3.8% |
| British West Indians | 2.4 /100 | #239 | Tragic 3.8% |
| Immigrants | Ecuador | 2.3 /100 | #240 | Tragic 3.8% |
| Alaskan Athabascans | 2.3 /100 | #241 | Tragic 3.8% |
| Native Hawaiians | 2.3 /100 | #242 | Tragic 3.8% |
| Guamanians/Chamorros | 2.2 /100 | #243 | Tragic 3.8% |
| Immigrants | Bahamas | 2.0 /100 | #244 | Tragic 3.8% |
| French American Indians | 1.7 /100 | #245 | Tragic 3.8% |
| Marshallese | 1.7 /100 | #246 | Tragic 3.8% |
| Guyanese | 1.6 /100 | #247 | Tragic 3.8% |
| Hmong | 1.6 /100 | #248 | Tragic 3.7% |
| Immigrants | Grenada | 1.5 /100 | #249 | Tragic 3.7% |
| Immigrants | Fiji | 1.5 /100 | #250 | Tragic 3.7% |
Demographics Similar to Immigrants from Saudi Arabia by Professional Degree
In terms of professional degree, the demographic groups most similar to Immigrants from Saudi Arabia are Argentinean (5.9%, a difference of 0.16%), Estonian (6.0%, a difference of 0.32%), New Zealander (6.0%, a difference of 0.33%), Cambodian (6.0%, a difference of 0.52%), and Immigrants from South Central Asia (5.9%, a difference of 0.61%).
| Demographics | Rating | Rank | Professional Degree |
| Immigrants | Russia | 100.0 /100 | #36 | Exceptional 6.0% |
| Immigrants | Austria | 100.0 /100 | #37 | Exceptional 6.0% |
| Immigrants | Norway | 100.0 /100 | #38 | Exceptional 6.0% |
| Immigrants | South Africa | 100.0 /100 | #39 | Exceptional 6.0% |
| Cambodians | 100.0 /100 | #40 | Exceptional 6.0% |
| New Zealanders | 100.0 /100 | #41 | Exceptional 6.0% |
| Estonians | 100.0 /100 | #42 | Exceptional 6.0% |
| Immigrants | Saudi Arabia | 100.0 /100 | #43 | Exceptional 5.9% |
| Argentineans | 100.0 /100 | #44 | Exceptional 5.9% |
| Immigrants | South Central Asia | 100.0 /100 | #45 | Exceptional 5.9% |
| Immigrants | Argentina | 100.0 /100 | #46 | Exceptional 5.9% |
| Australians | 100.0 /100 | #47 | Exceptional 5.9% |
| Paraguayans | 100.0 /100 | #48 | Exceptional 5.9% |
| Immigrants | Latvia | 100.0 /100 | #49 | Exceptional 5.8% |
| Immigrants | Czechoslovakia | 100.0 /100 | #50 | Exceptional 5.8% |