Bhutanese vs Immigrants from Portugal Professional Degree

COMPARE

Bhutanese
Race
Ancestry
AfghanAfricanAlaska NativeAlaskan AthabascanAlbanianAleutAlsatianAmericanApacheArabArapahoArgentineanArmenianAssyrian/Chaldean/SyriacAustralianAustrianBahamianBangladeshiBarbadianBasqueBelgianBelizeanBermudanBhutaneseBlackfeetBolivianBrazilianBritishBritish West IndianBulgarianBurmeseCajunCambodianCanadianCape VerdeanCarpatho RusynCelticCentral AmericanCentral American IndianCherokeeCheyenneChickasawChileanChineseChippewaChoctawColombianColvilleComancheCosta RicanCreeCreekCroatianCrowCubanCypriotCzechCzechoslovakianDanishDelawareDominicanDutchDutch West IndianEastern EuropeanEcuadorianEgyptianEnglishEstonianEthiopianEuropeanFijianFilipinoFinnishFrenchFrench American IndianFrench CanadianGermanGerman RussianGhanaianGreekGuamanian/ChamorroGuatemalanGuyaneseHaitianHmongHonduranHopiHoumaHungarianIcelanderIndian (Asian)IndonesianInupiatIranianIraqiIrishIroquoisIsraeliItalianJamaicanJapaneseJordanianKenyanKiowaKoreanLaotianLatvianLebaneseLiberianLithuanianLumbeeLuxembourgerMacedonianMalaysianMalteseMarshalleseMenomineeMexicanMexican American IndianMongolianMoroccanNative HawaiianNavajoNepaleseNew ZealanderNicaraguanNigerianNorthern EuropeanNorwegianOkinawanOsageOttawaPaiutePakistaniPalestinianPanamanianParaguayanPennsylvania GermanPeruvianPimaPolishPortuguesePotawatomiPuebloPuerto RicanPuget Sound SalishRomanianRussianSalvadoranSamoanScandinavianScotch-IrishScottishSeminoleSenegaleseSerbianShoshoneSierra LeoneanSiouxSlavicSlovakSloveneSomaliSouth AfricanSouth AmericanSouth American IndianSoviet UnionSpaniardSpanishSpanish AmericanSpanish American IndianSri LankanSubsaharan AfricanSudaneseSwedishSwissSyrianTaiwaneseThaiTlingit-HaidaTohono O'OdhamTonganTrinidadian and TobagonianTsimshianTurkishU.S. Virgin IslanderUgandanUkrainianUruguayanUteVenezuelanVietnameseWelshWest IndianYakamaYaquiYugoslavianYumanYup'ikZimbabwean
Immigration
NonimmigrantsImmigrantsAfghanistanAfricaAlbaniaArgentinaArmeniaAsiaAustraliaAustriaBahamasBangladeshBarbadosBelarusBelgiumBelizeBoliviaBosnia and HerzegovinaBrazilBulgariaBurma/MyanmarCabo VerdeCambodiaCameroonCanadaCaribbeanCentral AmericaChileChinaColombiaCongoCosta RicaCroatiaCubaCzechoslovakiaDenmarkDominicaDominican RepublicEastern AfricaEastern AsiaEastern EuropeEcuadorEgyptEl SalvadorEnglandEritreaEthiopiaEuropeFijiFranceGermanyGhanaGreeceGrenadaGuatemalaGuyanaHaitiHondurasHong KongHungaryIndiaIndonesiaIranIraqIrelandIsraelItalyJamaicaJapanJordanKazakhstanKenyaKoreaKuwaitLaosLatin AmericaLatviaLebanonLiberiaLithuaniaMalaysiaMexicoMicronesiaMiddle AfricaMoldovaMoroccoNepalNetherlandsNicaraguaNigeriaNorth AmericaNorth MacedoniaNorthern AfricaNorthern EuropeNorwayOceaniaPakistanPanamaPeruPhilippinesPolandRomaniaRussiaSaudi ArabiaScotlandSenegalSerbiaSierra LeoneSingaporeSomaliaSouth AfricaSouth AmericaSouth Central AsiaSouth Eastern AsiaSouthern EuropeSpainSri LankaSt. Vincent and the GrenadinesSudanSwedenSwitzerlandSyriaTaiwanThailandTrinidad and TobagoTurkeyUgandaUkraineUruguayUzbekistanVenezuelaVietnamWest IndiesWestern AfricaWestern AsiaWestern EuropeYemenZaireZimbabweAzores
Immigrants from Portugal
Race
Ancestry
AfghanAfricanAlaska NativeAlaskan AthabascanAlbanianAleutAlsatianAmericanApacheArabArapahoArgentineanArmenianAssyrian/Chaldean/SyriacAustralianAustrianBahamianBangladeshiBarbadianBasqueBelgianBelizeanBermudanBlackfeetBolivianBrazilianBritishBritish West IndianBulgarianBurmeseCajunCambodianCanadianCape VerdeanCarpatho RusynCelticCentral AmericanCentral American IndianCherokeeCheyenneChickasawChileanChineseChippewaChoctawColombianColvilleComancheCosta RicanCreeCreekCroatianCrowCubanCypriotCzechCzechoslovakianDanishDelawareDominicanDutchDutch West IndianEastern EuropeanEcuadorianEgyptianEnglishEstonianEthiopianEuropeanFijianFilipinoFinnishFrenchFrench American IndianFrench CanadianGermanGerman RussianGhanaianGreekGuamanian/ChamorroGuatemalanGuyaneseHaitianHmongHonduranHopiHoumaHungarianIcelanderIndian (Asian)IndonesianInupiatIranianIraqiIrishIroquoisIsraeliItalianJamaicanJapaneseJordanianKenyanKiowaKoreanLaotianLatvianLebaneseLiberianLithuanianLumbeeLuxembourgerMacedonianMalaysianMalteseMarshalleseMenomineeMexicanMexican American IndianMongolianMoroccanNative HawaiianNavajoNepaleseNew ZealanderNicaraguanNigerianNorthern EuropeanNorwegianOkinawanOsageOttawaPaiutePakistaniPalestinianPanamanianParaguayanPennsylvania GermanPeruvianPimaPolishPortuguesePotawatomiPuebloPuerto RicanPuget Sound SalishRomanianRussianSalvadoranSamoanScandinavianScotch-IrishScottishSeminoleSenegaleseSerbianShoshoneSierra LeoneanSiouxSlavicSlovakSloveneSomaliSouth AfricanSouth AmericanSouth American IndianSoviet UnionSpaniardSpanishSpanish AmericanSpanish American IndianSri LankanSubsaharan AfricanSudaneseSwedishSwissSyrianTaiwaneseThaiTlingit-HaidaTohono O'OdhamTonganTrinidadian and TobagonianTsimshianTurkishU.S. Virgin IslanderUgandanUkrainianUruguayanUteVenezuelanVietnameseWelshWest IndianYakamaYaquiYugoslavianYumanYup'ikZimbabwean
Immigration
NonimmigrantsImmigrantsAfghanistanAfricaAlbaniaArgentinaArmeniaAsiaAustraliaAustriaBahamasBangladeshBarbadosBelarusBelgiumBelizeBoliviaBosnia and HerzegovinaBrazilBulgariaBurma/MyanmarCabo VerdeCambodiaCameroonCanadaCaribbeanCentral AmericaChileChinaColombiaCongoCosta RicaCroatiaCubaCzechoslovakiaDenmarkDominicaDominican RepublicEastern AfricaEastern AsiaEastern EuropeEcuadorEgyptEl SalvadorEnglandEritreaEthiopiaEuropeFijiFranceGermanyGhanaGreeceGrenadaGuatemalaGuyanaHaitiHondurasHong KongHungaryIndiaIndonesiaIranIraqIrelandIsraelItalyJamaicaJapanJordanKazakhstanKenyaKoreaKuwaitLaosLatin AmericaLatviaLebanonLiberiaLithuaniaMalaysiaMexicoMicronesiaMiddle AfricaMoldovaMoroccoNepalNetherlandsNicaraguaNigeriaNorth AmericaNorth MacedoniaNorthern AfricaNorthern EuropeNorwayOceaniaPakistanPanamaPeruPhilippinesPolandPortugalRomaniaRussiaSaudi ArabiaScotlandSenegalSerbiaSierra LeoneSingaporeSomaliaSouth AfricaSouth AmericaSouth Central AsiaSouth Eastern AsiaSouthern EuropeSpainSri LankaSt. Vincent and the GrenadinesSudanSwedenSwitzerlandSyriaTaiwanThailandTrinidad and TobagoTurkeyUgandaUkraineUruguayUzbekistanVenezuelaVietnamWest IndiesWestern AfricaWestern AsiaWestern EuropeYemenZaireZimbabweAzores
Professional Degree
Income
Poverty
Unemployment
Labor Participation
Family Structure
Vehicle Availability
Education Level
Disability

Professional Degree Comparison

Bhutanese

Immigrants from Portugal

Exceptional
Tragic
5.4%
PROFESSIONAL DEGREE
99.8/ 100
METRIC RATING
70th/ 347
METRIC RANK
3.5%
PROFESSIONAL DEGREE
0.5/ 100
METRIC RATING
279th/ 347
METRIC RANK

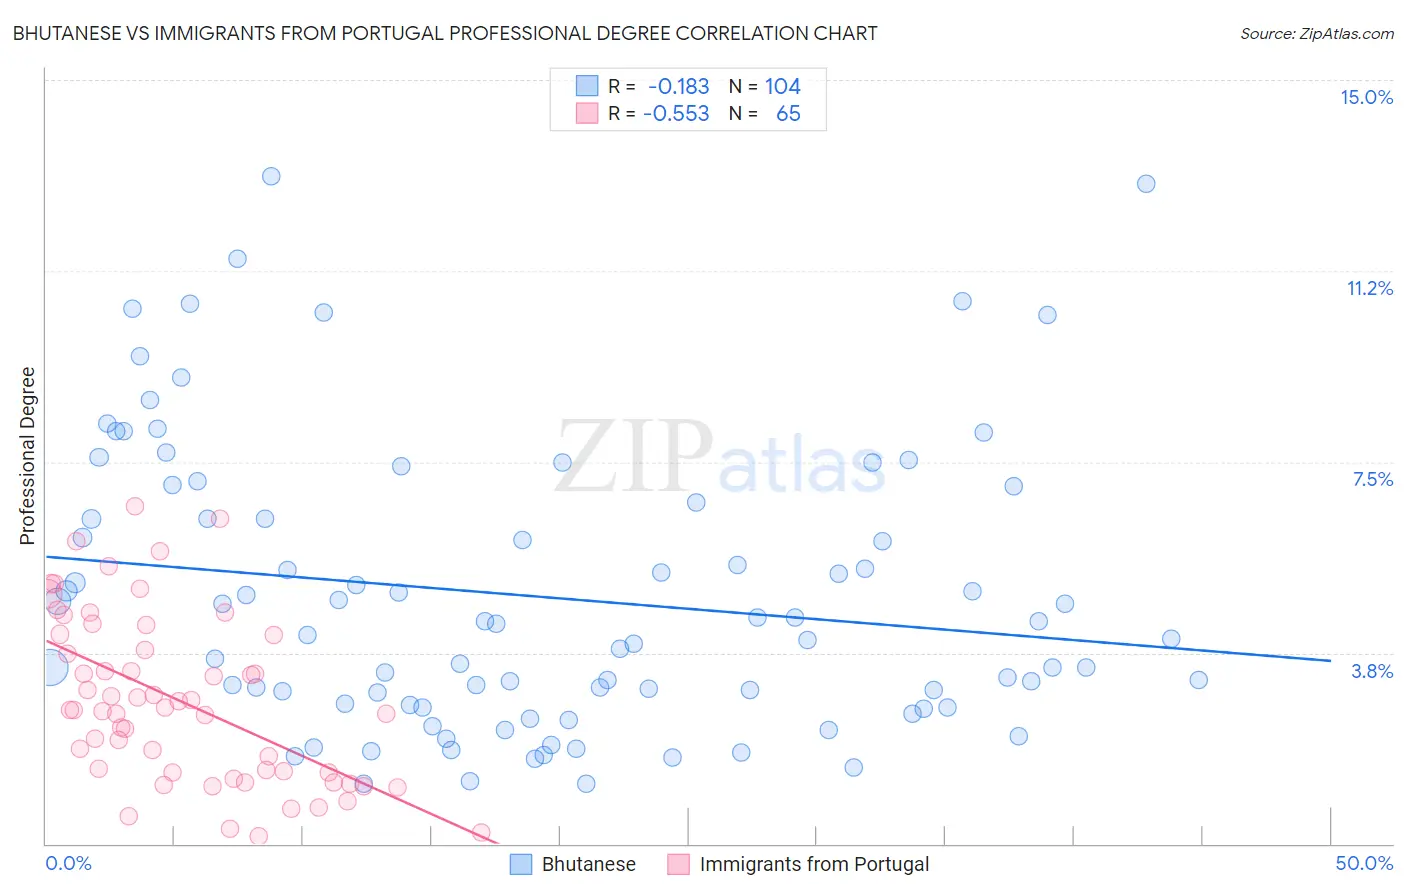
Bhutanese vs Immigrants from Portugal Professional Degree Correlation Chart

The statistical analysis conducted on geographies consisting of 454,048,564 people shows a poor negative correlation between the proportion of Bhutanese and percentage of population with at least professional degree education in the United States with a correlation coefficient (R) of -0.183 and weighted average of 5.4%. Similarly, the statistical analysis conducted on geographies consisting of 174,657,094 people shows a substantial negative correlation between the proportion of Immigrants from Portugal and percentage of population with at least professional degree education in the United States with a correlation coefficient (R) of -0.553 and weighted average of 3.5%, a difference of 53.3%.
Bhutanese vs Immigrants from Portugal Professional Degree

Professional Degree Correlation Summary

MeasurementBhutaneseImmigrants from Portugal
Minimum1.2%0.14%
Maximum13.1%6.6%
Range12.0%6.5%
Mean4.9%2.8%
Median4.2%2.6%
Interquartile 25% (IQ1)2.7%1.4%
Interquartile 75% (IQ3)6.6%4.1%
Interquartile Range (IQR)3.8%2.7%
Standard Deviation (Sample)2.8%1.6%
Standard Deviation (Population)2.8%1.6%

Similar Demographics by Professional Degree

Demographics Similar to Bhutanese by Professional Degree

In terms of professional degree, the demographic groups most similar to Bhutanese are Immigrants from Hungary (5.5%, a difference of 0.33%), Immigrants from Lebanon (5.5%, a difference of 0.41%), Immigrants from Bulgaria (5.5%, a difference of 0.59%), Immigrants from Western Asia (5.4%, a difference of 0.59%), and Immigrants from Kazakhstan (5.5%, a difference of 0.92%).
DemographicsRating | RankProfessional Degree
Asians
99.9
/100
|
#63
Exceptional
5.5%
Immigrants | Asia
99.9
/100
|
#64
Exceptional
5.5%
Immigrants | Bolivia
99.9
/100
|
#65
Exceptional
5.5%
Immigrants | Kazakhstan
99.9
/100
|
#66
Exceptional
5.5%
Immigrants | Bulgaria
99.9
/100
|
#67
Exceptional
5.5%
Immigrants | Lebanon
99.9
/100
|
#68
Exceptional
5.5%
Immigrants | Hungary
99.9
/100
|
#69
Exceptional
5.5%
Bhutanese
99.8
/100
|
#70
Exceptional
5.4%
Immigrants | Western Asia
99.8
/100
|
#71
Exceptional
5.4%
Lithuanians
99.8
/100
|
#72
Exceptional
5.4%
Immigrants | Romania
99.8
/100
|
#73
Exceptional
5.4%
Ethiopians
99.7
/100
|
#74
Exceptional
5.4%
Immigrants | Indonesia
99.7
/100
|
#75
Exceptional
5.3%
Immigrants | Canada
99.7
/100
|
#76
Exceptional
5.3%
Immigrants | Ethiopia
99.7
/100
|
#77
Exceptional
5.3%

Demographics Similar to Immigrants from Portugal by Professional Degree

In terms of professional degree, the demographic groups most similar to Immigrants from Portugal are Japanese (3.5%, a difference of 0.040%), Dominican (3.5%, a difference of 0.040%), Apache (3.5%, a difference of 0.060%), Immigrants from Caribbean (3.5%, a difference of 0.080%), and Cheyenne (3.6%, a difference of 0.10%).
DemographicsRating | RankProfessional Degree
Immigrants | Jamaica
0.5
/100
|
#272
Tragic
3.6%
Americans
0.5
/100
|
#273
Tragic
3.6%
Potawatomi
0.5
/100
|
#274
Tragic
3.6%
Immigrants | Dominica
0.5
/100
|
#275
Tragic
3.6%
Liberians
0.5
/100
|
#276
Tragic
3.6%
Cheyenne
0.5
/100
|
#277
Tragic
3.6%
Japanese
0.5
/100
|
#278
Tragic
3.5%
Immigrants | Portugal
0.5
/100
|
#279
Tragic
3.5%
Dominicans
0.5
/100
|
#280
Tragic
3.5%
Apache
0.5
/100
|
#281
Tragic
3.5%
Immigrants | Caribbean
0.5
/100
|
#282
Tragic
3.5%
Comanche
0.4
/100
|
#283
Tragic
3.5%
Salvadorans
0.4
/100
|
#284
Tragic
3.5%
Hondurans
0.3
/100
|
#285
Tragic
3.5%
Haitians
0.3
/100
|
#286
Tragic
3.5%