Greek vs Immigrants from Bangladesh Doctorate Degree
COMPARE
Greek
Immigrants from Bangladesh
Doctorate Degree
Doctorate Degree Comparison
Greeks
Immigrants from Bangladesh
2.1%
DOCTORATE DEGREE
98.8/ 100
METRIC RATING
94th/ 347
METRIC RANK
1.8%
DOCTORATE DEGREE
50.0/ 100
METRIC RATING
174th/ 347
METRIC RANK
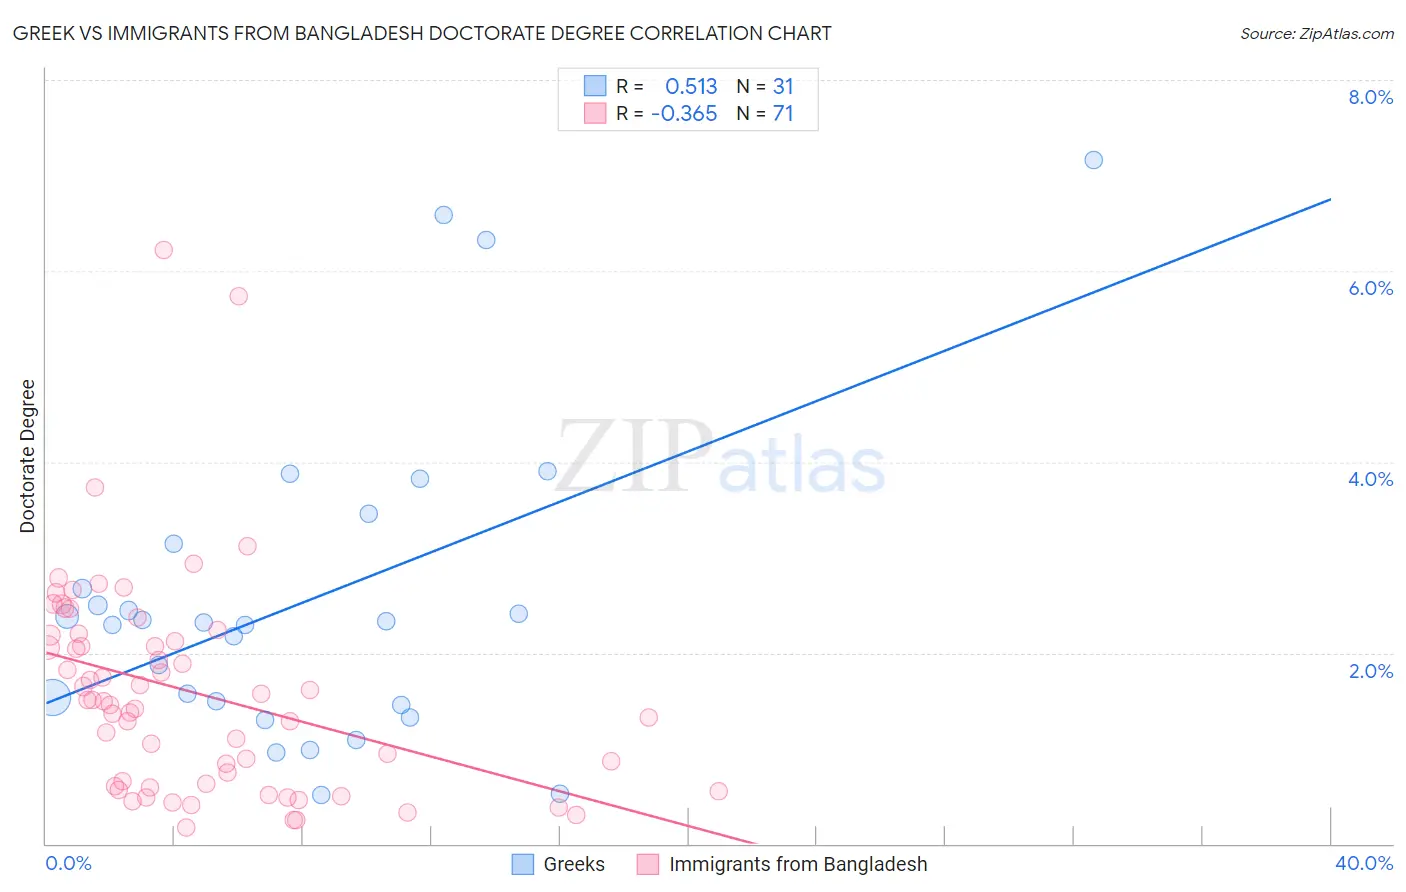
Greek vs Immigrants from Bangladesh Doctorate Degree Correlation Chart
The statistical analysis conducted on geographies consisting of 475,132,187 people shows a substantial positive correlation between the proportion of Greeks and percentage of population with at least doctorate degree education in the United States with a correlation coefficient (R) of 0.513 and weighted average of 2.1%. Similarly, the statistical analysis conducted on geographies consisting of 203,048,073 people shows a mild negative correlation between the proportion of Immigrants from Bangladesh and percentage of population with at least doctorate degree education in the United States with a correlation coefficient (R) of -0.365 and weighted average of 1.8%, a difference of 16.0%.
Doctorate Degree Correlation Summary
| Measurement | Greek | Immigrants from Bangladesh |
| Minimum | 0.51% | 0.17% |
| Maximum | 7.2% | 6.2% |
| Range | 6.7% | 6.0% |
| Mean | 2.5% | 1.6% |
| Median | 2.3% | 1.5% |
| Interquartile 25% (IQ1) | 1.5% | 0.60% |
| Interquartile 75% (IQ3) | 3.1% | 2.2% |
| Interquartile Range (IQR) | 1.7% | 1.6% |
| Standard Deviation (Sample) | 1.7% | 1.1% |
| Standard Deviation (Population) | 1.6% | 1.1% |
Similar Demographics by Doctorate Degree
Demographics Similar to Greeks by Doctorate Degree
In terms of doctorate degree, the demographic groups most similar to Greeks are Immigrants from Romania (2.1%, a difference of 0.15%), Alsatian (2.1%, a difference of 0.64%), Immigrants from Northern Africa (2.1%, a difference of 0.73%), Chilean (2.2%, a difference of 0.85%), and Immigrants from Eritrea (2.1%, a difference of 0.87%).
| Demographics | Rating | Rank | Doctorate Degree |
| Immigrants | Zimbabwe | 99.4 /100 | #87 | Exceptional 2.2% |
| Immigrants | Nepal | 99.3 /100 | #88 | Exceptional 2.2% |
| British | 99.3 /100 | #89 | Exceptional 2.2% |
| Immigrants | Scotland | 99.2 /100 | #90 | Exceptional 2.2% |
| Immigrants | Sudan | 99.1 /100 | #91 | Exceptional 2.2% |
| Chileans | 99.1 /100 | #92 | Exceptional 2.2% |
| Alsatians | 99.0 /100 | #93 | Exceptional 2.1% |
| Greeks | 98.8 /100 | #94 | Exceptional 2.1% |
| Immigrants | Romania | 98.7 /100 | #95 | Exceptional 2.1% |
| Immigrants | Northern Africa | 98.4 /100 | #96 | Exceptional 2.1% |
| Immigrants | Eritrea | 98.4 /100 | #97 | Exceptional 2.1% |
| Armenians | 98.3 /100 | #98 | Exceptional 2.1% |
| Immigrants | Egypt | 98.2 /100 | #99 | Exceptional 2.1% |
| Immigrants | Eastern Europe | 98.2 /100 | #100 | Exceptional 2.1% |
| Immigrants | Eastern Africa | 98.2 /100 | #101 | Exceptional 2.1% |
Demographics Similar to Immigrants from Bangladesh by Doctorate Degree
In terms of doctorate degree, the demographic groups most similar to Immigrants from Bangladesh are Norwegian (1.8%, a difference of 0.0%), Belgian (1.8%, a difference of 0.040%), Immigrants from Thailand (1.8%, a difference of 0.080%), Spanish (1.8%, a difference of 0.10%), and Iraqi (1.8%, a difference of 0.11%).
| Demographics | Rating | Rank | Doctorate Degree |
| Macedonians | 60.9 /100 | #167 | Good 1.9% |
| Sri Lankans | 60.3 /100 | #168 | Good 1.9% |
| Vietnamese | 54.8 /100 | #169 | Average 1.9% |
| Costa Ricans | 53.3 /100 | #170 | Average 1.8% |
| Bermudans | 52.1 /100 | #171 | Average 1.8% |
| Belgians | 50.3 /100 | #172 | Average 1.8% |
| Norwegians | 50.0 /100 | #173 | Average 1.8% |
| Immigrants | Bangladesh | 50.0 /100 | #174 | Average 1.8% |
| Immigrants | Thailand | 49.4 /100 | #175 | Average 1.8% |
| Spanish | 49.3 /100 | #176 | Average 1.8% |
| Iraqis | 49.2 /100 | #177 | Average 1.8% |
| French | 48.8 /100 | #178 | Average 1.8% |
| Ghanaians | 48.3 /100 | #179 | Average 1.8% |
| Scandinavians | 48.0 /100 | #180 | Average 1.8% |
| Immigrants | Immigrants | 46.2 /100 | #181 | Average 1.8% |