Marshallese vs Immigrants from Bangladesh Doctorate Degree
COMPARE
Marshallese
Immigrants from Bangladesh
Doctorate Degree
Doctorate Degree Comparison
Marshallese
Immigrants from Bangladesh
1.5%
DOCTORATE DEGREE
0.4/ 100
METRIC RATING
279th/ 347
METRIC RANK
1.8%
DOCTORATE DEGREE
50.0/ 100
METRIC RATING
174th/ 347
METRIC RANK
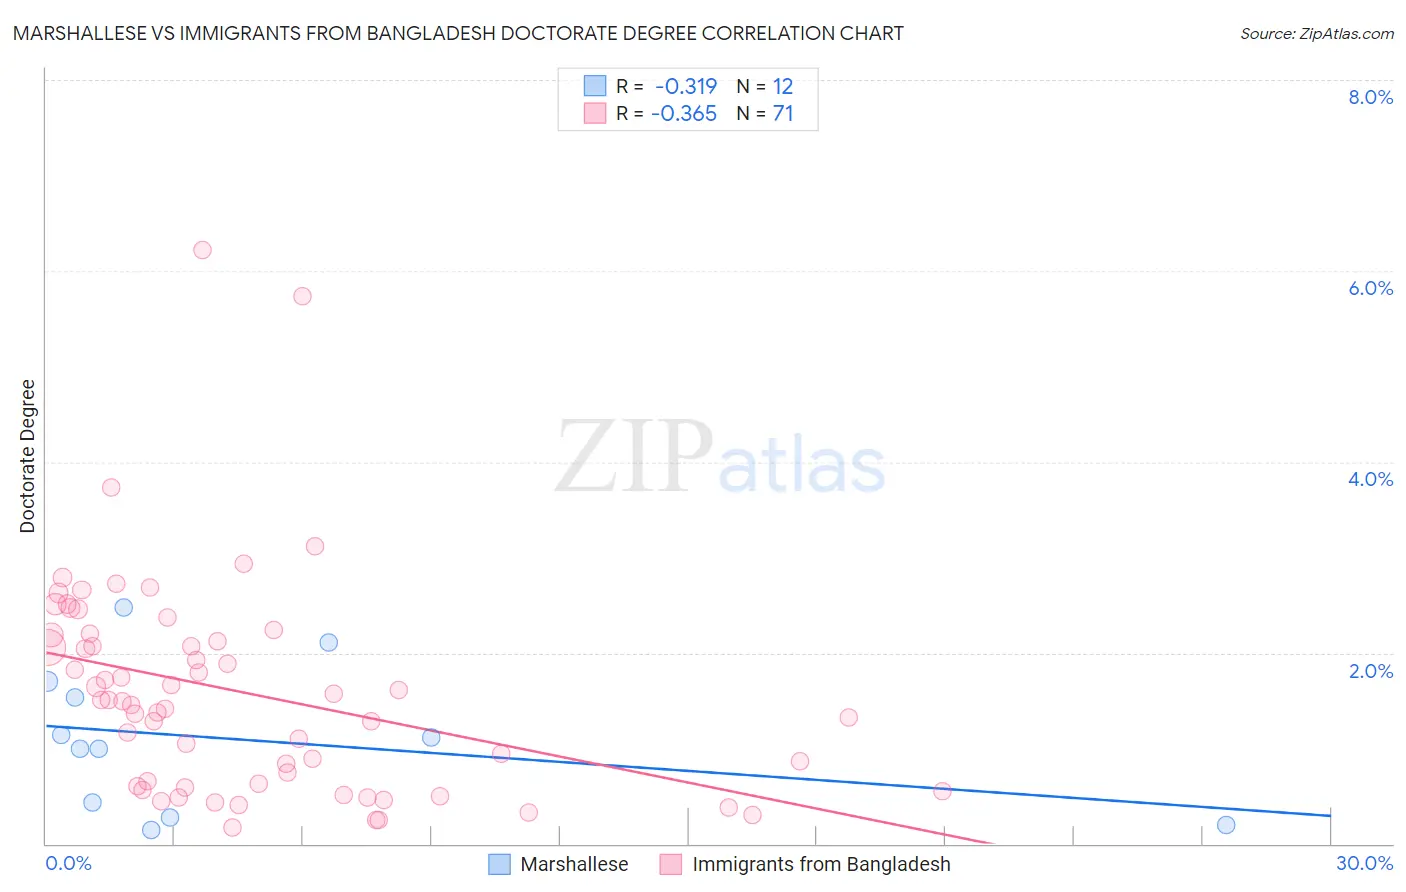
Marshallese vs Immigrants from Bangladesh Doctorate Degree Correlation Chart
The statistical analysis conducted on geographies consisting of 14,742,598 people shows a mild negative correlation between the proportion of Marshallese and percentage of population with at least doctorate degree education in the United States with a correlation coefficient (R) of -0.319 and weighted average of 1.5%. Similarly, the statistical analysis conducted on geographies consisting of 203,048,073 people shows a mild negative correlation between the proportion of Immigrants from Bangladesh and percentage of population with at least doctorate degree education in the United States with a correlation coefficient (R) of -0.365 and weighted average of 1.8%, a difference of 26.0%.
Doctorate Degree Correlation Summary
| Measurement | Marshallese | Immigrants from Bangladesh |
| Minimum | 0.14% | 0.17% |
| Maximum | 2.5% | 6.2% |
| Range | 2.3% | 6.0% |
| Mean | 1.1% | 1.6% |
| Median | 1.1% | 1.5% |
| Interquartile 25% (IQ1) | 0.35% | 0.60% |
| Interquartile 75% (IQ3) | 1.6% | 2.2% |
| Interquartile Range (IQR) | 1.3% | 1.6% |
| Standard Deviation (Sample) | 0.76% | 1.1% |
| Standard Deviation (Population) | 0.73% | 1.1% |
Similar Demographics by Doctorate Degree
Demographics Similar to Marshallese by Doctorate Degree
In terms of doctorate degree, the demographic groups most similar to Marshallese are Ecuadorian (1.5%, a difference of 0.010%), Tohono O'odham (1.5%, a difference of 0.080%), British West Indian (1.5%, a difference of 0.13%), Central American (1.5%, a difference of 0.18%), and Hawaiian (1.5%, a difference of 0.22%).
| Demographics | Rating | Rank | Doctorate Degree |
| Immigrants | Barbados | 0.4 /100 | #272 | Tragic 1.5% |
| Sioux | 0.4 /100 | #273 | Tragic 1.5% |
| Yaqui | 0.4 /100 | #274 | Tragic 1.5% |
| Aleuts | 0.4 /100 | #275 | Tragic 1.5% |
| Paiute | 0.4 /100 | #276 | Tragic 1.5% |
| Bahamians | 0.4 /100 | #277 | Tragic 1.5% |
| Hawaiians | 0.4 /100 | #278 | Tragic 1.5% |
| Marshallese | 0.4 /100 | #279 | Tragic 1.5% |
| Ecuadorians | 0.4 /100 | #280 | Tragic 1.5% |
| Tohono O'odham | 0.4 /100 | #281 | Tragic 1.5% |
| British West Indians | 0.3 /100 | #282 | Tragic 1.5% |
| Central Americans | 0.3 /100 | #283 | Tragic 1.5% |
| Jamaicans | 0.3 /100 | #284 | Tragic 1.5% |
| Malaysians | 0.3 /100 | #285 | Tragic 1.5% |
| Cherokee | 0.3 /100 | #286 | Tragic 1.5% |
Demographics Similar to Immigrants from Bangladesh by Doctorate Degree
In terms of doctorate degree, the demographic groups most similar to Immigrants from Bangladesh are Norwegian (1.8%, a difference of 0.0%), Belgian (1.8%, a difference of 0.040%), Immigrants from Thailand (1.8%, a difference of 0.080%), Spanish (1.8%, a difference of 0.10%), and Iraqi (1.8%, a difference of 0.11%).
| Demographics | Rating | Rank | Doctorate Degree |
| Macedonians | 60.9 /100 | #167 | Good 1.9% |
| Sri Lankans | 60.3 /100 | #168 | Good 1.9% |
| Vietnamese | 54.8 /100 | #169 | Average 1.9% |
| Costa Ricans | 53.3 /100 | #170 | Average 1.8% |
| Bermudans | 52.1 /100 | #171 | Average 1.8% |
| Belgians | 50.3 /100 | #172 | Average 1.8% |
| Norwegians | 50.0 /100 | #173 | Average 1.8% |
| Immigrants | Bangladesh | 50.0 /100 | #174 | Average 1.8% |
| Immigrants | Thailand | 49.4 /100 | #175 | Average 1.8% |
| Spanish | 49.3 /100 | #176 | Average 1.8% |
| Iraqis | 49.2 /100 | #177 | Average 1.8% |
| French | 48.8 /100 | #178 | Average 1.8% |
| Ghanaians | 48.3 /100 | #179 | Average 1.8% |
| Scandinavians | 48.0 /100 | #180 | Average 1.8% |
| Immigrants | Immigrants | 46.2 /100 | #181 | Average 1.8% |