Eastern European vs Immigrants from Bangladesh Doctorate Degree
COMPARE
Eastern European
Immigrants from Bangladesh
Doctorate Degree
Doctorate Degree Comparison
Eastern Europeans
Immigrants from Bangladesh
2.8%
DOCTORATE DEGREE
100.0/ 100
METRIC RATING
16th/ 347
METRIC RANK
1.8%
DOCTORATE DEGREE
50.0/ 100
METRIC RATING
174th/ 347
METRIC RANK
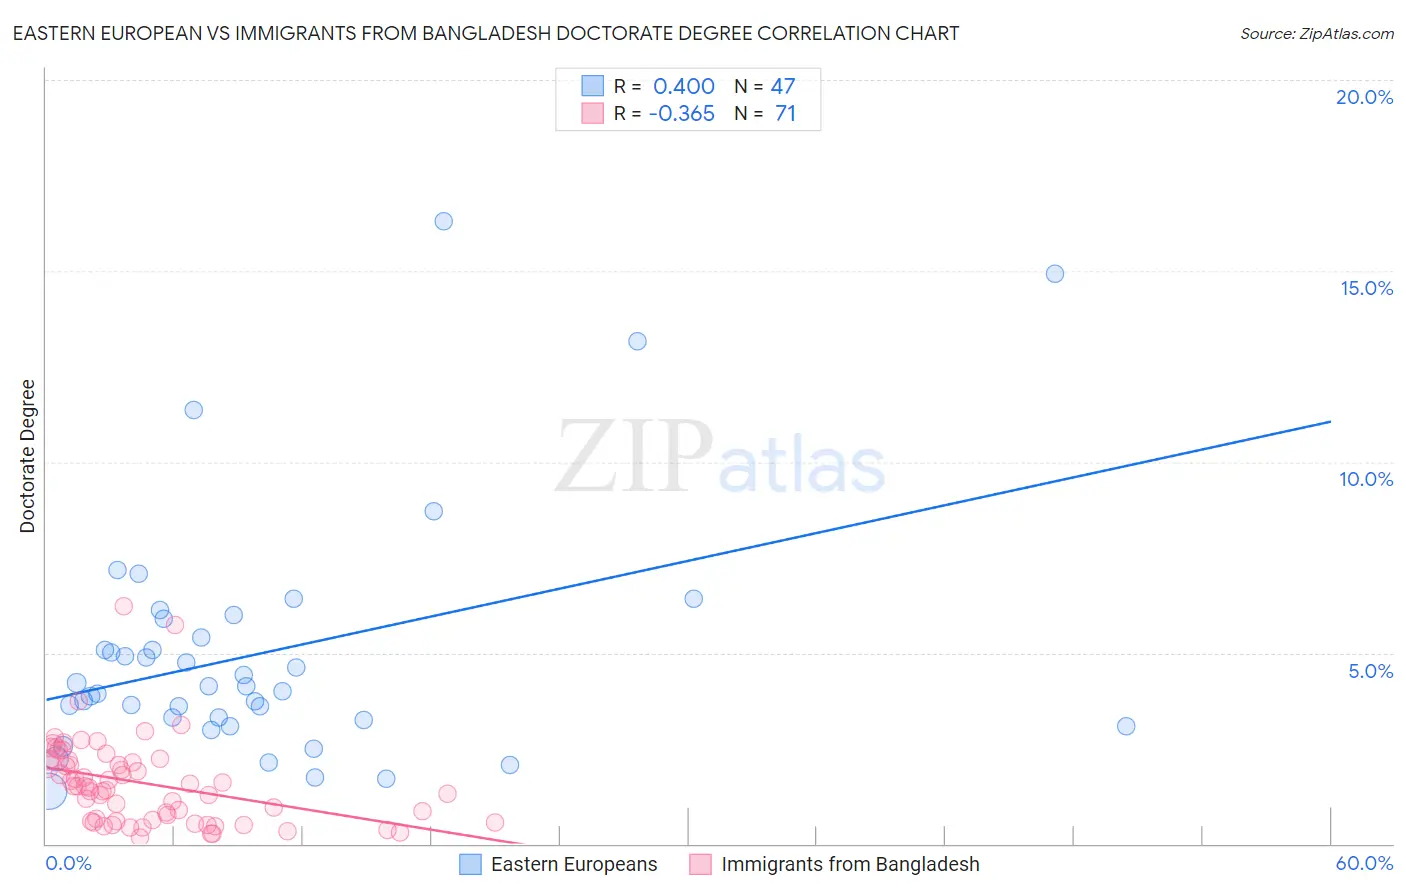
Eastern European vs Immigrants from Bangladesh Doctorate Degree Correlation Chart
The statistical analysis conducted on geographies consisting of 454,559,491 people shows a moderate positive correlation between the proportion of Eastern Europeans and percentage of population with at least doctorate degree education in the United States with a correlation coefficient (R) of 0.400 and weighted average of 2.8%. Similarly, the statistical analysis conducted on geographies consisting of 203,048,073 people shows a mild negative correlation between the proportion of Immigrants from Bangladesh and percentage of population with at least doctorate degree education in the United States with a correlation coefficient (R) of -0.365 and weighted average of 1.8%, a difference of 53.4%.
Doctorate Degree Correlation Summary
| Measurement | Eastern European | Immigrants from Bangladesh |
| Minimum | 1.4% | 0.17% |
| Maximum | 16.3% | 6.2% |
| Range | 14.9% | 6.0% |
| Mean | 5.0% | 1.6% |
| Median | 4.1% | 1.5% |
| Interquartile 25% (IQ1) | 3.2% | 0.60% |
| Interquartile 75% (IQ3) | 5.9% | 2.2% |
| Interquartile Range (IQR) | 2.7% | 1.6% |
| Standard Deviation (Sample) | 3.2% | 1.1% |
| Standard Deviation (Population) | 3.2% | 1.1% |
Similar Demographics by Doctorate Degree
Demographics Similar to Eastern Europeans by Doctorate Degree
In terms of doctorate degree, the demographic groups most similar to Eastern Europeans are Immigrants from India (2.8%, a difference of 0.32%), Immigrants from Australia (2.8%, a difference of 0.70%), Immigrants from Sri Lanka (2.8%, a difference of 0.94%), Immigrants from Japan (2.8%, a difference of 1.3%), and Immigrants from France (2.9%, a difference of 1.5%).
| Demographics | Rating | Rank | Doctorate Degree |
| Immigrants | Iran | 100.0 /100 | #9 | Exceptional 3.0% |
| Immigrants | Eastern Asia | 100.0 /100 | #10 | Exceptional 3.0% |
| Indians (Asian) | 100.0 /100 | #11 | Exceptional 2.9% |
| Immigrants | Belgium | 100.0 /100 | #12 | Exceptional 2.9% |
| Immigrants | Sweden | 100.0 /100 | #13 | Exceptional 2.9% |
| Immigrants | France | 100.0 /100 | #14 | Exceptional 2.9% |
| Immigrants | India | 100.0 /100 | #15 | Exceptional 2.8% |
| Eastern Europeans | 100.0 /100 | #16 | Exceptional 2.8% |
| Immigrants | Australia | 100.0 /100 | #17 | Exceptional 2.8% |
| Immigrants | Sri Lanka | 100.0 /100 | #18 | Exceptional 2.8% |
| Immigrants | Japan | 100.0 /100 | #19 | Exceptional 2.8% |
| Immigrants | Hong Kong | 100.0 /100 | #20 | Exceptional 2.8% |
| Thais | 100.0 /100 | #21 | Exceptional 2.8% |
| Mongolians | 100.0 /100 | #22 | Exceptional 2.8% |
| Immigrants | Denmark | 100.0 /100 | #23 | Exceptional 2.8% |
Demographics Similar to Immigrants from Bangladesh by Doctorate Degree
In terms of doctorate degree, the demographic groups most similar to Immigrants from Bangladesh are Norwegian (1.8%, a difference of 0.0%), Belgian (1.8%, a difference of 0.040%), Immigrants from Thailand (1.8%, a difference of 0.080%), Spanish (1.8%, a difference of 0.10%), and Iraqi (1.8%, a difference of 0.11%).
| Demographics | Rating | Rank | Doctorate Degree |
| Macedonians | 60.9 /100 | #167 | Good 1.9% |
| Sri Lankans | 60.3 /100 | #168 | Good 1.9% |
| Vietnamese | 54.8 /100 | #169 | Average 1.9% |
| Costa Ricans | 53.3 /100 | #170 | Average 1.8% |
| Bermudans | 52.1 /100 | #171 | Average 1.8% |
| Belgians | 50.3 /100 | #172 | Average 1.8% |
| Norwegians | 50.0 /100 | #173 | Average 1.8% |
| Immigrants | Bangladesh | 50.0 /100 | #174 | Average 1.8% |
| Immigrants | Thailand | 49.4 /100 | #175 | Average 1.8% |
| Spanish | 49.3 /100 | #176 | Average 1.8% |
| Iraqis | 49.2 /100 | #177 | Average 1.8% |
| French | 48.8 /100 | #178 | Average 1.8% |
| Ghanaians | 48.3 /100 | #179 | Average 1.8% |
| Scandinavians | 48.0 /100 | #180 | Average 1.8% |
| Immigrants | Immigrants | 46.2 /100 | #181 | Average 1.8% |