Greek vs Laotian Doctorate Degree
COMPARE
Greek
Laotian
Doctorate Degree
Doctorate Degree Comparison
Greeks
Laotians
2.1%
DOCTORATE DEGREE
98.8/ 100
METRIC RATING
94th/ 347
METRIC RANK
2.3%
DOCTORATE DEGREE
99.9/ 100
METRIC RATING
63rd/ 347
METRIC RANK
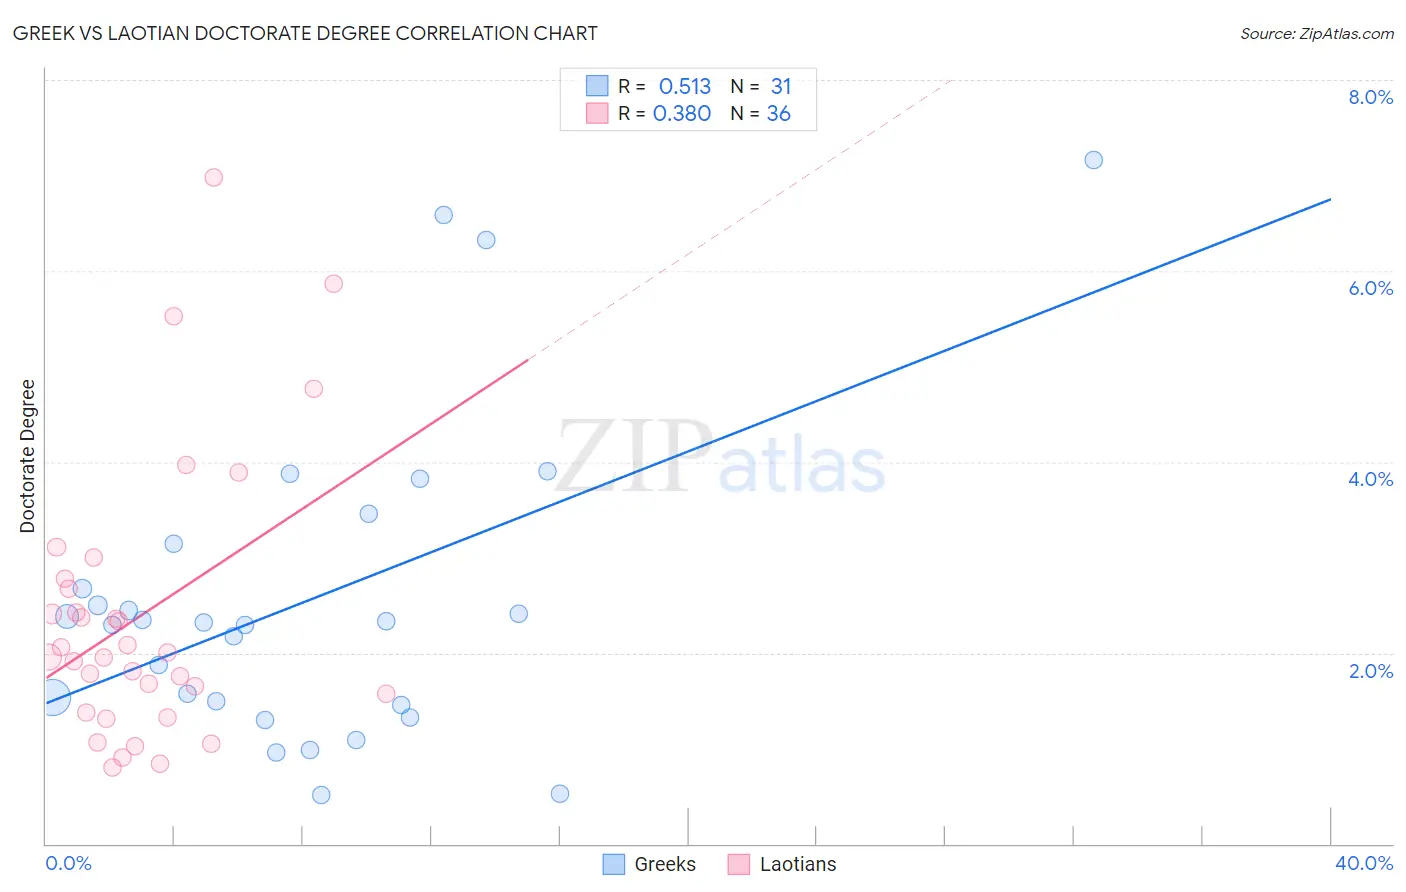
Greek vs Laotian Doctorate Degree Correlation Chart
The statistical analysis conducted on geographies consisting of 475,132,187 people shows a substantial positive correlation between the proportion of Greeks and percentage of population with at least doctorate degree education in the United States with a correlation coefficient (R) of 0.513 and weighted average of 2.1%. Similarly, the statistical analysis conducted on geographies consisting of 224,228,494 people shows a mild positive correlation between the proportion of Laotians and percentage of population with at least doctorate degree education in the United States with a correlation coefficient (R) of 0.380 and weighted average of 2.3%, a difference of 8.1%.
Doctorate Degree Correlation Summary
| Measurement | Greek | Laotian |
| Minimum | 0.51% | 0.80% |
| Maximum | 7.2% | 7.0% |
| Range | 6.7% | 6.2% |
| Mean | 2.5% | 2.4% |
| Median | 2.3% | 2.0% |
| Interquartile 25% (IQ1) | 1.5% | 1.5% |
| Interquartile 75% (IQ3) | 3.1% | 2.7% |
| Interquartile Range (IQR) | 1.7% | 1.3% |
| Standard Deviation (Sample) | 1.7% | 1.5% |
| Standard Deviation (Population) | 1.6% | 1.4% |
Similar Demographics by Doctorate Degree
Demographics Similar to Greeks by Doctorate Degree
In terms of doctorate degree, the demographic groups most similar to Greeks are Immigrants from Romania (2.1%, a difference of 0.15%), Alsatian (2.1%, a difference of 0.64%), Immigrants from Northern Africa (2.1%, a difference of 0.73%), Chilean (2.2%, a difference of 0.85%), and Immigrants from Eritrea (2.1%, a difference of 0.87%).
| Demographics | Rating | Rank | Doctorate Degree |
| Immigrants | Zimbabwe | 99.4 /100 | #87 | Exceptional 2.2% |
| Immigrants | Nepal | 99.3 /100 | #88 | Exceptional 2.2% |
| British | 99.3 /100 | #89 | Exceptional 2.2% |
| Immigrants | Scotland | 99.2 /100 | #90 | Exceptional 2.2% |
| Immigrants | Sudan | 99.1 /100 | #91 | Exceptional 2.2% |
| Chileans | 99.1 /100 | #92 | Exceptional 2.2% |
| Alsatians | 99.0 /100 | #93 | Exceptional 2.1% |
| Greeks | 98.8 /100 | #94 | Exceptional 2.1% |
| Immigrants | Romania | 98.7 /100 | #95 | Exceptional 2.1% |
| Immigrants | Northern Africa | 98.4 /100 | #96 | Exceptional 2.1% |
| Immigrants | Eritrea | 98.4 /100 | #97 | Exceptional 2.1% |
| Armenians | 98.3 /100 | #98 | Exceptional 2.1% |
| Immigrants | Egypt | 98.2 /100 | #99 | Exceptional 2.1% |
| Immigrants | Eastern Europe | 98.2 /100 | #100 | Exceptional 2.1% |
| Immigrants | Eastern Africa | 98.2 /100 | #101 | Exceptional 2.1% |
Demographics Similar to Laotians by Doctorate Degree
In terms of doctorate degree, the demographic groups most similar to Laotians are Immigrants from Europe (2.3%, a difference of 0.090%), Immigrants from Greece (2.3%, a difference of 0.40%), Bhutanese (2.3%, a difference of 0.62%), Paraguayan (2.3%, a difference of 0.90%), and Argentinean (2.3%, a difference of 1.1%).
| Demographics | Rating | Rank | Doctorate Degree |
| Immigrants | Czechoslovakia | 100.0 /100 | #56 | Exceptional 2.4% |
| Immigrants | Ethiopia | 100.0 /100 | #57 | Exceptional 2.4% |
| Ethiopians | 99.9 /100 | #58 | Exceptional 2.3% |
| South Africans | 99.9 /100 | #59 | Exceptional 2.3% |
| Immigrants | Serbia | 99.9 /100 | #60 | Exceptional 2.3% |
| Bhutanese | 99.9 /100 | #61 | Exceptional 2.3% |
| Immigrants | Europe | 99.9 /100 | #62 | Exceptional 2.3% |
| Laotians | 99.9 /100 | #63 | Exceptional 2.3% |
| Immigrants | Greece | 99.9 /100 | #64 | Exceptional 2.3% |
| Paraguayans | 99.9 /100 | #65 | Exceptional 2.3% |
| Argentineans | 99.9 /100 | #66 | Exceptional 2.3% |
| Zimbabweans | 99.8 /100 | #67 | Exceptional 2.3% |
| Immigrants | Kazakhstan | 99.8 /100 | #68 | Exceptional 2.3% |
| Carpatho Rusyns | 99.8 /100 | #69 | Exceptional 2.3% |
| Lithuanians | 99.8 /100 | #70 | Exceptional 2.3% |