Inupiat vs Ethiopian High School Diploma
COMPARE
Inupiat
Ethiopian
High School Diploma
High School Diploma Comparison
Inupiat
Ethiopians
88.5%
HIGH SCHOOL DIPLOMA
13.1/ 100
METRIC RATING
211th/ 347
METRIC RANK
89.0%
HIGH SCHOOL DIPLOMA
37.0/ 100
METRIC RATING
185th/ 347
METRIC RANK
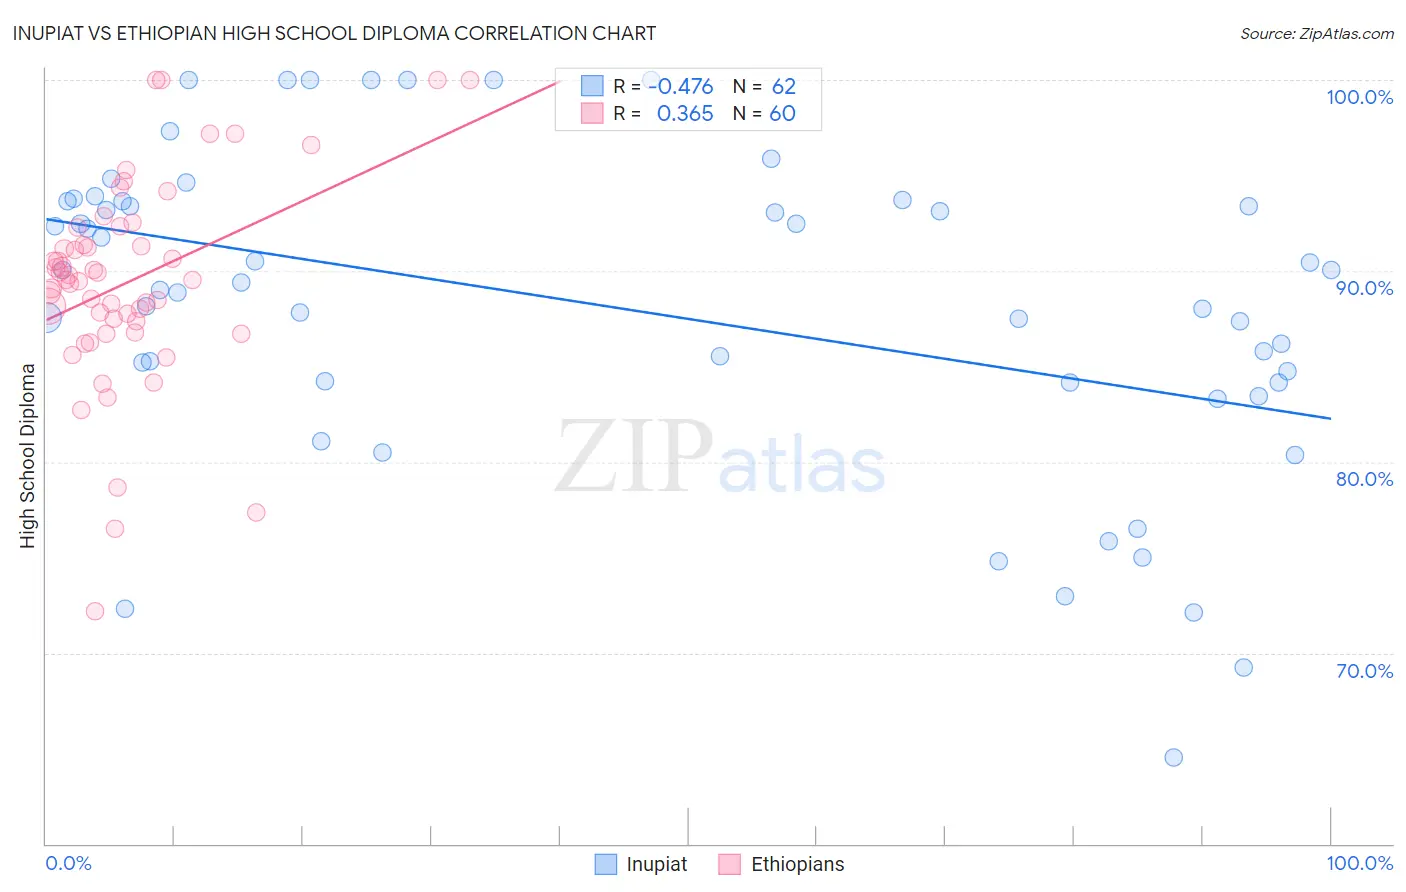
Inupiat vs Ethiopian High School Diploma Correlation Chart
The statistical analysis conducted on geographies consisting of 96,349,180 people shows a moderate negative correlation between the proportion of Inupiat and percentage of population with at least high school diploma education in the United States with a correlation coefficient (R) of -0.476 and weighted average of 88.5%. Similarly, the statistical analysis conducted on geographies consisting of 223,235,367 people shows a mild positive correlation between the proportion of Ethiopians and percentage of population with at least high school diploma education in the United States with a correlation coefficient (R) of 0.365 and weighted average of 89.0%, a difference of 0.52%.
High School Diploma Correlation Summary
| Measurement | Inupiat | Ethiopian |
| Minimum | 64.5% | 72.2% |
| Maximum | 100.0% | 100.0% |
| Range | 35.5% | 27.8% |
| Mean | 88.1% | 89.4% |
| Median | 89.2% | 89.5% |
| Interquartile 25% (IQ1) | 84.2% | 87.1% |
| Interquartile 75% (IQ3) | 93.6% | 91.8% |
| Interquartile Range (IQR) | 9.4% | 4.7% |
| Standard Deviation (Sample) | 8.3% | 5.4% |
| Standard Deviation (Population) | 8.2% | 5.4% |
Similar Demographics by High School Diploma
Demographics Similar to Inupiat by High School Diploma
In terms of high school diploma, the demographic groups most similar to Inupiat are Samoan (88.5%, a difference of 0.030%), South American Indian (88.5%, a difference of 0.030%), Portuguese (88.5%, a difference of 0.040%), Cherokee (88.5%, a difference of 0.040%), and Immigrants from Somalia (88.4%, a difference of 0.070%).
| Demographics | Rating | Rank | High School Diploma |
| Armenians | 17.2 /100 | #204 | Poor 88.6% |
| Immigrants | Micronesia | 16.4 /100 | #205 | Poor 88.6% |
| Arapaho | 16.1 /100 | #206 | Poor 88.6% |
| Immigrants | Sierra Leone | 15.8 /100 | #207 | Poor 88.6% |
| Portuguese | 14.4 /100 | #208 | Poor 88.5% |
| Cherokee | 14.3 /100 | #209 | Poor 88.5% |
| Samoans | 14.0 /100 | #210 | Poor 88.5% |
| Inupiat | 13.1 /100 | #211 | Poor 88.5% |
| South American Indians | 12.2 /100 | #212 | Poor 88.5% |
| Immigrants | Somalia | 11.3 /100 | #213 | Poor 88.4% |
| Immigrants | Cameroon | 10.9 /100 | #214 | Poor 88.4% |
| Crow | 10.9 /100 | #215 | Poor 88.4% |
| Chickasaw | 10.7 /100 | #216 | Poor 88.4% |
| Immigrants | Africa | 10.6 /100 | #217 | Poor 88.4% |
| Immigrants | Bolivia | 10.3 /100 | #218 | Poor 88.4% |
Demographics Similar to Ethiopians by High School Diploma
In terms of high school diploma, the demographic groups most similar to Ethiopians are Immigrants from Eastern Africa (88.9%, a difference of 0.020%), Guamanian/Chamorro (88.9%, a difference of 0.020%), Immigrants from Syria (89.0%, a difference of 0.040%), Immigrants from Sudan (88.9%, a difference of 0.060%), and Immigrants from Uganda (88.9%, a difference of 0.070%).
| Demographics | Rating | Rank | High School Diploma |
| Sierra Leoneans | 48.4 /100 | #178 | Average 89.1% |
| Americans | 47.2 /100 | #179 | Average 89.1% |
| Bolivians | 45.2 /100 | #180 | Average 89.1% |
| Venezuelans | 43.6 /100 | #181 | Average 89.1% |
| Spaniards | 43.4 /100 | #182 | Average 89.1% |
| Potawatomi | 42.5 /100 | #183 | Average 89.0% |
| Immigrants | Syria | 39.2 /100 | #184 | Fair 89.0% |
| Ethiopians | 37.0 /100 | #185 | Fair 89.0% |
| Immigrants | Eastern Africa | 35.8 /100 | #186 | Fair 88.9% |
| Guamanians/Chamorros | 35.5 /100 | #187 | Fair 88.9% |
| Immigrants | Sudan | 33.4 /100 | #188 | Fair 88.9% |
| Immigrants | Uganda | 32.6 /100 | #189 | Fair 88.9% |
| Immigrants | Chile | 31.9 /100 | #190 | Fair 88.9% |
| Immigrants | Ethiopia | 30.9 /100 | #191 | Fair 88.9% |
| Moroccans | 29.5 /100 | #192 | Fair 88.8% |