Sudanese vs Immigrants from Cuba Associate's Degree
COMPARE
Sudanese
Immigrants from Cuba
Associate's Degree
Associate's Degree Comparison
Sudanese
Immigrants from Cuba
47.1%
ASSOCIATE'S DEGREE
70.3/ 100
METRIC RATING
157th/ 347
METRIC RANK
39.5%
ASSOCIATE'S DEGREE
0.0/ 100
METRIC RATING
288th/ 347
METRIC RANK
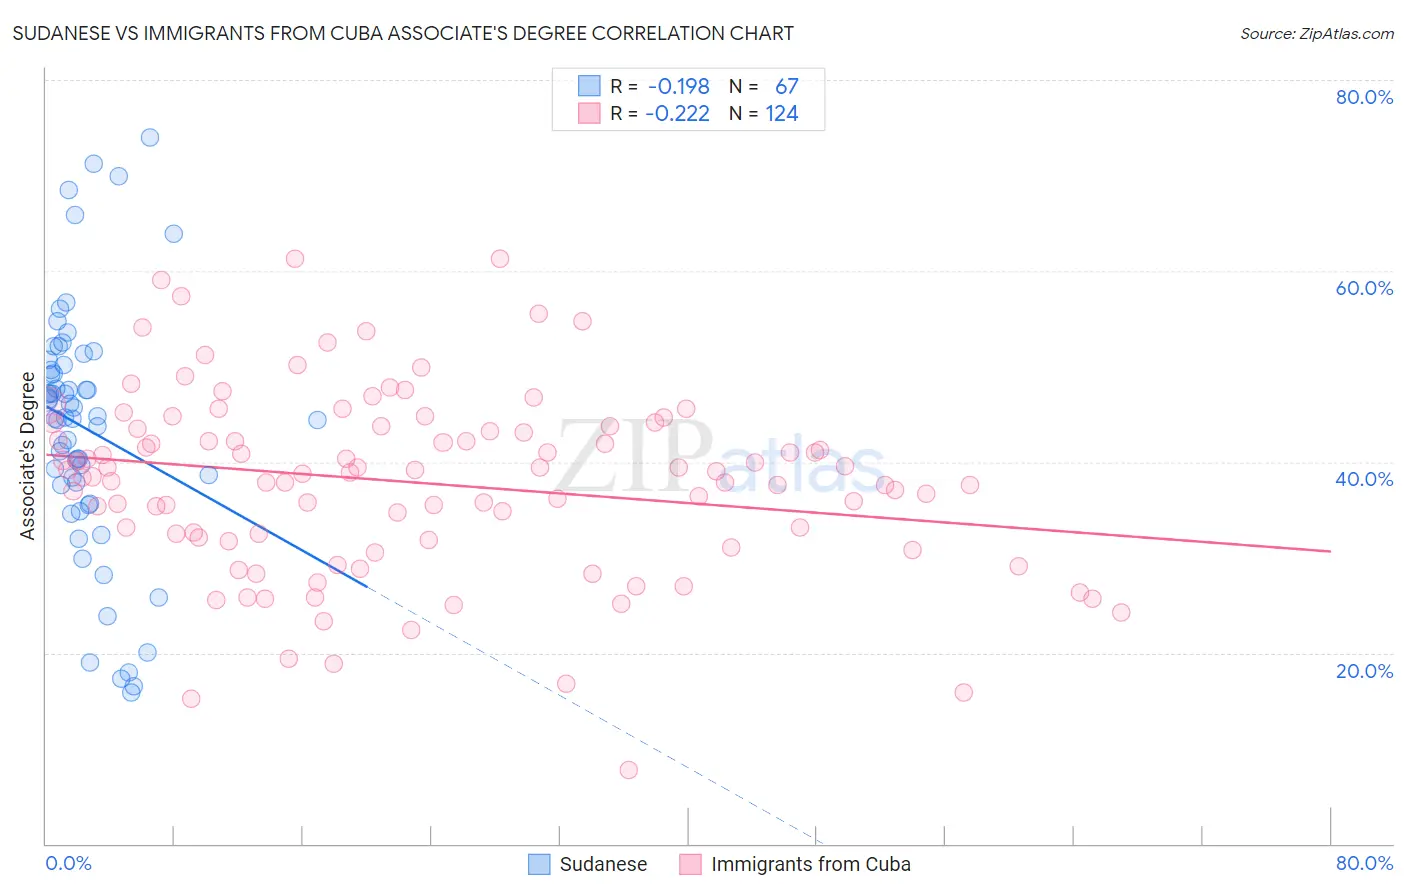
Sudanese vs Immigrants from Cuba Associate's Degree Correlation Chart
The statistical analysis conducted on geographies consisting of 110,144,981 people shows a poor negative correlation between the proportion of Sudanese and percentage of population with at least associate's degree education in the United States with a correlation coefficient (R) of -0.198 and weighted average of 47.1%. Similarly, the statistical analysis conducted on geographies consisting of 325,963,552 people shows a weak negative correlation between the proportion of Immigrants from Cuba and percentage of population with at least associate's degree education in the United States with a correlation coefficient (R) of -0.222 and weighted average of 39.5%, a difference of 19.1%.
Associate's Degree Correlation Summary
| Measurement | Sudanese | Immigrants from Cuba |
| Minimum | 15.8% | 7.8% |
| Maximum | 74.0% | 61.3% |
| Range | 58.2% | 53.5% |
| Mean | 43.5% | 37.8% |
| Median | 44.6% | 38.8% |
| Interquartile 25% (IQ1) | 37.6% | 31.9% |
| Interquartile 75% (IQ3) | 50.2% | 43.6% |
| Interquartile Range (IQR) | 12.6% | 11.7% |
| Standard Deviation (Sample) | 12.9% | 9.7% |
| Standard Deviation (Population) | 12.8% | 9.6% |
Similar Demographics by Associate's Degree
Demographics Similar to Sudanese by Associate's Degree
In terms of associate's degree, the demographic groups most similar to Sudanese are South American (47.1%, a difference of 0.020%), Kenyan (47.1%, a difference of 0.030%), Immigrants from Germany (47.1%, a difference of 0.040%), Immigrants from Poland (47.1%, a difference of 0.090%), and Immigrants from Kenya (47.2%, a difference of 0.16%).
| Demographics | Rating | Rank | Associate's Degree |
| Iraqis | 76.2 /100 | #150 | Good 47.4% |
| Immigrants | North Macedonia | 76.0 /100 | #151 | Good 47.4% |
| Immigrants | Afghanistan | 74.3 /100 | #152 | Good 47.3% |
| Czechs | 72.2 /100 | #153 | Good 47.2% |
| Immigrants | Kenya | 72.1 /100 | #154 | Good 47.2% |
| Kenyans | 70.6 /100 | #155 | Good 47.1% |
| South Americans | 70.5 /100 | #156 | Good 47.1% |
| Sudanese | 70.3 /100 | #157 | Good 47.1% |
| Immigrants | Germany | 69.7 /100 | #158 | Good 47.1% |
| Immigrants | Poland | 69.2 /100 | #159 | Good 47.1% |
| Scottish | 65.4 /100 | #160 | Good 46.9% |
| Scandinavians | 65.2 /100 | #161 | Good 46.9% |
| Immigrants | Africa | 63.2 /100 | #162 | Good 46.8% |
| Somalis | 62.5 /100 | #163 | Good 46.8% |
| Colombians | 62.4 /100 | #164 | Good 46.8% |
Demographics Similar to Immigrants from Cuba by Associate's Degree
In terms of associate's degree, the demographic groups most similar to Immigrants from Cuba are Aleut (39.6%, a difference of 0.24%), Central American (39.4%, a difference of 0.26%), Immigrants from Caribbean (39.7%, a difference of 0.50%), Immigrants from Haiti (39.3%, a difference of 0.71%), and Dominican (39.3%, a difference of 0.72%).
| Demographics | Rating | Rank | Associate's Degree |
| Immigrants | Portugal | 0.1 /100 | #281 | Tragic 40.1% |
| Bangladeshis | 0.1 /100 | #282 | Tragic 40.0% |
| Haitians | 0.1 /100 | #283 | Tragic 40.0% |
| Comanche | 0.1 /100 | #284 | Tragic 39.9% |
| Immigrants | Belize | 0.1 /100 | #285 | Tragic 39.9% |
| Immigrants | Caribbean | 0.0 /100 | #286 | Tragic 39.7% |
| Aleuts | 0.0 /100 | #287 | Tragic 39.6% |
| Immigrants | Cuba | 0.0 /100 | #288 | Tragic 39.5% |
| Central Americans | 0.0 /100 | #289 | Tragic 39.4% |
| Immigrants | Haiti | 0.0 /100 | #290 | Tragic 39.3% |
| Dominicans | 0.0 /100 | #291 | Tragic 39.3% |
| Blacks/African Americans | 0.0 /100 | #292 | Tragic 39.1% |
| Nepalese | 0.0 /100 | #293 | Tragic 39.0% |
| Salvadorans | 0.0 /100 | #294 | Tragic 39.0% |
| Hondurans | 0.0 /100 | #295 | Tragic 38.9% |