Spanish vs Immigrants from Cuba Associate's Degree
COMPARE
Spanish
Immigrants from Cuba
Associate's Degree
Associate's Degree Comparison
Spanish
Immigrants from Cuba
44.4%
ASSOCIATE'S DEGREE
9.4/ 100
METRIC RATING
218th/ 347
METRIC RANK
39.5%
ASSOCIATE'S DEGREE
0.0/ 100
METRIC RATING
288th/ 347
METRIC RANK
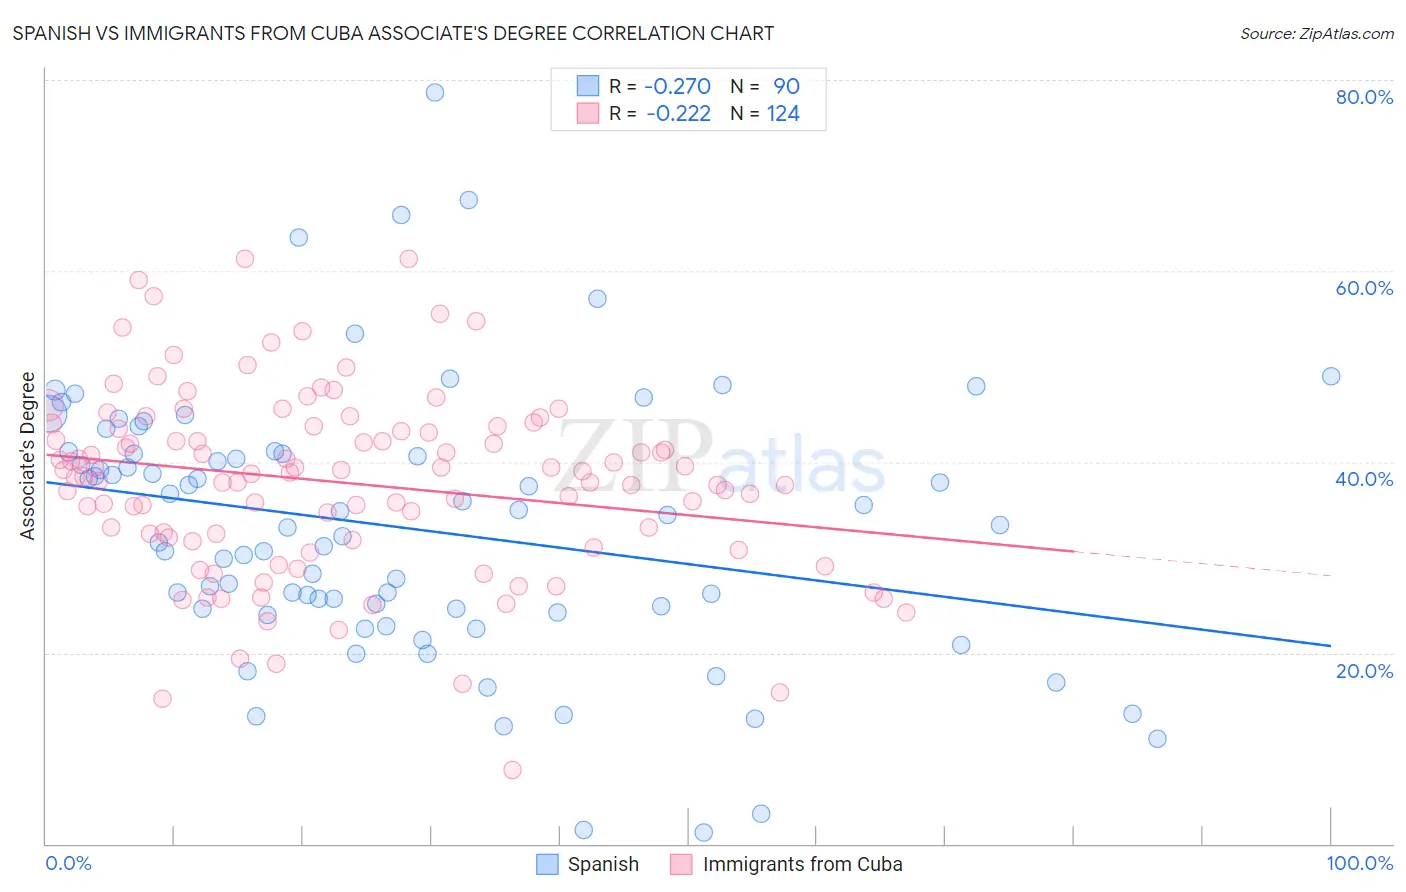
Spanish vs Immigrants from Cuba Associate's Degree Correlation Chart
The statistical analysis conducted on geographies consisting of 422,178,546 people shows a weak negative correlation between the proportion of Spanish and percentage of population with at least associate's degree education in the United States with a correlation coefficient (R) of -0.270 and weighted average of 44.4%. Similarly, the statistical analysis conducted on geographies consisting of 325,963,552 people shows a weak negative correlation between the proportion of Immigrants from Cuba and percentage of population with at least associate's degree education in the United States with a correlation coefficient (R) of -0.222 and weighted average of 39.5%, a difference of 12.2%.
Associate's Degree Correlation Summary
| Measurement | Spanish | Immigrants from Cuba |
| Minimum | 1.2% | 7.8% |
| Maximum | 78.7% | 61.3% |
| Range | 77.5% | 53.5% |
| Mean | 33.1% | 37.8% |
| Median | 33.2% | 38.8% |
| Interquartile 25% (IQ1) | 24.7% | 31.9% |
| Interquartile 75% (IQ3) | 40.9% | 43.6% |
| Interquartile Range (IQR) | 16.2% | 11.7% |
| Standard Deviation (Sample) | 14.1% | 9.7% |
| Standard Deviation (Population) | 14.1% | 9.6% |
Similar Demographics by Associate's Degree
Demographics Similar to Spanish by Associate's Degree
In terms of associate's degree, the demographic groups most similar to Spanish are Immigrants (44.5%, a difference of 0.25%), Immigrants from Nigeria (44.6%, a difference of 0.43%), White/Caucasian (44.2%, a difference of 0.48%), Portuguese (44.1%, a difference of 0.55%), and Immigrants from Panama (44.7%, a difference of 0.61%).
| Demographics | Rating | Rank | Associate's Degree |
| Immigrants | Zaire | 16.6 /100 | #211 | Poor 45.0% |
| French Canadians | 15.0 /100 | #212 | Poor 44.9% |
| Immigrants | Ghana | 14.2 /100 | #213 | Poor 44.8% |
| Immigrants | Middle Africa | 12.7 /100 | #214 | Poor 44.7% |
| Immigrants | Panama | 12.4 /100 | #215 | Poor 44.7% |
| Immigrants | Nigeria | 11.4 /100 | #216 | Poor 44.6% |
| Immigrants | Immigrants | 10.5 /100 | #217 | Poor 44.5% |
| Spanish | 9.4 /100 | #218 | Tragic 44.4% |
| Whites/Caucasians | 7.5 /100 | #219 | Tragic 44.2% |
| Portuguese | 7.2 /100 | #220 | Tragic 44.1% |
| Immigrants | Western Africa | 6.6 /100 | #221 | Tragic 44.1% |
| Barbadians | 5.8 /100 | #222 | Tragic 43.9% |
| Sub-Saharan Africans | 5.5 /100 | #223 | Tragic 43.9% |
| West Indians | 5.2 /100 | #224 | Tragic 43.8% |
| Guamanians/Chamorros | 4.8 /100 | #225 | Tragic 43.8% |
Demographics Similar to Immigrants from Cuba by Associate's Degree
In terms of associate's degree, the demographic groups most similar to Immigrants from Cuba are Aleut (39.6%, a difference of 0.24%), Central American (39.4%, a difference of 0.26%), Immigrants from Caribbean (39.7%, a difference of 0.50%), Immigrants from Haiti (39.3%, a difference of 0.71%), and Dominican (39.3%, a difference of 0.72%).
| Demographics | Rating | Rank | Associate's Degree |
| Immigrants | Portugal | 0.1 /100 | #281 | Tragic 40.1% |
| Bangladeshis | 0.1 /100 | #282 | Tragic 40.0% |
| Haitians | 0.1 /100 | #283 | Tragic 40.0% |
| Comanche | 0.1 /100 | #284 | Tragic 39.9% |
| Immigrants | Belize | 0.1 /100 | #285 | Tragic 39.9% |
| Immigrants | Caribbean | 0.0 /100 | #286 | Tragic 39.7% |
| Aleuts | 0.0 /100 | #287 | Tragic 39.6% |
| Immigrants | Cuba | 0.0 /100 | #288 | Tragic 39.5% |
| Central Americans | 0.0 /100 | #289 | Tragic 39.4% |
| Immigrants | Haiti | 0.0 /100 | #290 | Tragic 39.3% |
| Dominicans | 0.0 /100 | #291 | Tragic 39.3% |
| Blacks/African Americans | 0.0 /100 | #292 | Tragic 39.1% |
| Nepalese | 0.0 /100 | #293 | Tragic 39.0% |
| Salvadorans | 0.0 /100 | #294 | Tragic 39.0% |
| Hondurans | 0.0 /100 | #295 | Tragic 38.9% |