Croatian vs Immigrants from Serbia Bachelor's Degree
COMPARE
Croatian
Immigrants from Serbia
Bachelor's Degree
Bachelor's Degree Comparison
Croatians
Immigrants from Serbia
40.6%
BACHELOR'S DEGREE
95.5/ 100
METRIC RATING
118th/ 347
METRIC RANK
44.1%
BACHELOR'S DEGREE
99.9/ 100
METRIC RATING
56th/ 347
METRIC RANK
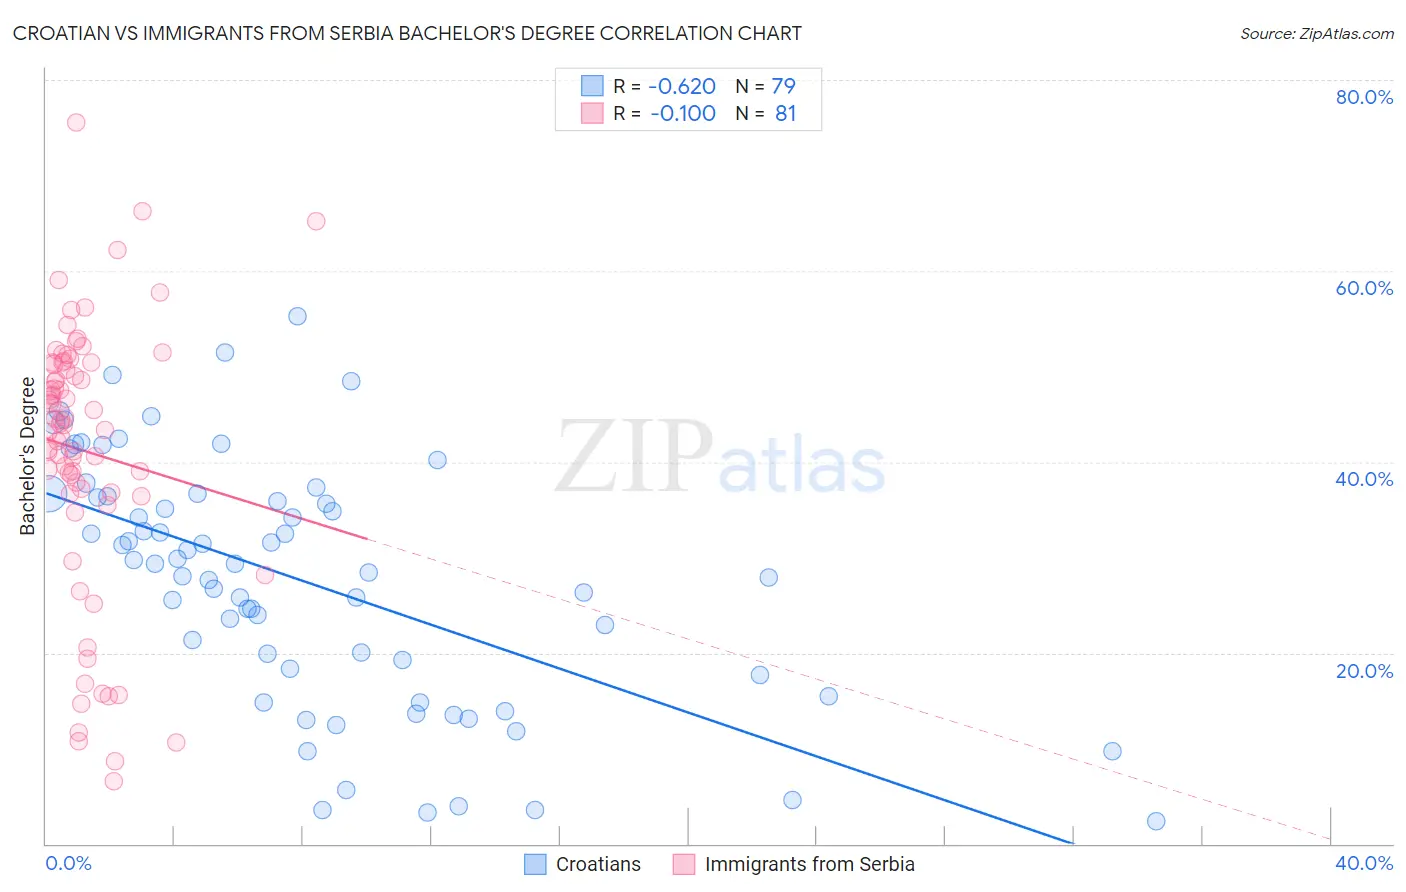
Croatian vs Immigrants from Serbia Bachelor's Degree Correlation Chart
The statistical analysis conducted on geographies consisting of 375,700,831 people shows a significant negative correlation between the proportion of Croatians and percentage of population with at least bachelor's degree education in the United States with a correlation coefficient (R) of -0.620 and weighted average of 40.6%. Similarly, the statistical analysis conducted on geographies consisting of 131,744,029 people shows a poor negative correlation between the proportion of Immigrants from Serbia and percentage of population with at least bachelor's degree education in the United States with a correlation coefficient (R) of -0.100 and weighted average of 44.1%, a difference of 8.6%.
Bachelor's Degree Correlation Summary
| Measurement | Croatian | Immigrants from Serbia |
| Minimum | 2.3% | 6.6% |
| Maximum | 55.2% | 75.5% |
| Range | 52.9% | 69.0% |
| Mean | 27.5% | 41.1% |
| Median | 29.3% | 44.0% |
| Interquartile 25% (IQ1) | 17.6% | 36.7% |
| Interquartile 75% (IQ3) | 36.5% | 50.4% |
| Interquartile Range (IQR) | 18.8% | 13.6% |
| Standard Deviation (Sample) | 12.8% | 14.2% |
| Standard Deviation (Population) | 12.8% | 14.1% |
Similar Demographics by Bachelor's Degree
Demographics Similar to Croatians by Bachelor's Degree
In terms of bachelor's degree, the demographic groups most similar to Croatians are Austrian (40.6%, a difference of 0.020%), Immigrants from Uganda (40.7%, a difference of 0.12%), Palestinian (40.7%, a difference of 0.17%), Immigrants from Syria (40.5%, a difference of 0.32%), and Venezuelan (40.5%, a difference of 0.39%).
| Demographics | Rating | Rank | Bachelor's Degree |
| Immigrants | Chile | 96.4 /100 | #111 | Exceptional 40.8% |
| Ugandans | 96.3 /100 | #112 | Exceptional 40.8% |
| Brazilians | 96.3 /100 | #113 | Exceptional 40.8% |
| Afghans | 96.2 /100 | #114 | Exceptional 40.8% |
| Palestinians | 95.8 /100 | #115 | Exceptional 40.7% |
| Immigrants | Uganda | 95.7 /100 | #116 | Exceptional 40.7% |
| Austrians | 95.5 /100 | #117 | Exceptional 40.6% |
| Croatians | 95.5 /100 | #118 | Exceptional 40.6% |
| Immigrants | Syria | 94.9 /100 | #119 | Exceptional 40.5% |
| Venezuelans | 94.7 /100 | #120 | Exceptional 40.5% |
| Moroccans | 94.6 /100 | #121 | Exceptional 40.5% |
| Immigrants | Albania | 94.4 /100 | #122 | Exceptional 40.4% |
| Lebanese | 94.3 /100 | #123 | Exceptional 40.4% |
| Immigrants | Eritrea | 94.3 /100 | #124 | Exceptional 40.4% |
| British | 94.2 /100 | #125 | Exceptional 40.4% |
Demographics Similar to Immigrants from Serbia by Bachelor's Degree
In terms of bachelor's degree, the demographic groups most similar to Immigrants from Serbia are Immigrants from Bolivia (44.2%, a difference of 0.18%), Immigrants from Austria (44.2%, a difference of 0.19%), Paraguayan (44.0%, a difference of 0.19%), Immigrants from Czechoslovakia (44.0%, a difference of 0.24%), and Australian (44.0%, a difference of 0.34%).
| Demographics | Rating | Rank | Bachelor's Degree |
| Immigrants | Norway | 99.9 /100 | #49 | Exceptional 44.5% |
| Immigrants | Greece | 99.9 /100 | #50 | Exceptional 44.5% |
| Asians | 99.9 /100 | #51 | Exceptional 44.4% |
| Immigrants | Spain | 99.9 /100 | #52 | Exceptional 44.3% |
| Immigrants | Asia | 99.9 /100 | #53 | Exceptional 44.3% |
| Immigrants | Austria | 99.9 /100 | #54 | Exceptional 44.2% |
| Immigrants | Bolivia | 99.9 /100 | #55 | Exceptional 44.2% |
| Immigrants | Serbia | 99.9 /100 | #56 | Exceptional 44.1% |
| Paraguayans | 99.9 /100 | #57 | Exceptional 44.0% |
| Immigrants | Czechoslovakia | 99.9 /100 | #58 | Exceptional 44.0% |
| Australians | 99.9 /100 | #59 | Exceptional 44.0% |
| New Zealanders | 99.9 /100 | #60 | Exceptional 44.0% |
| South Africans | 99.8 /100 | #61 | Exceptional 43.6% |
| Immigrants | Kazakhstan | 99.8 /100 | #62 | Exceptional 43.4% |
| Immigrants | Europe | 99.8 /100 | #63 | Exceptional 43.4% |