Comanche vs Immigrants from Romania 2nd Grade
COMPARE
Comanche
Immigrants from Romania
2nd Grade
2nd Grade Comparison
Comanche
Immigrants from Romania
97.9%
2ND GRADE
62.8/ 100
METRIC RATING
159th/ 347
METRIC RANK
98.0%
2ND GRADE
88.3/ 100
METRIC RATING
137th/ 347
METRIC RANK
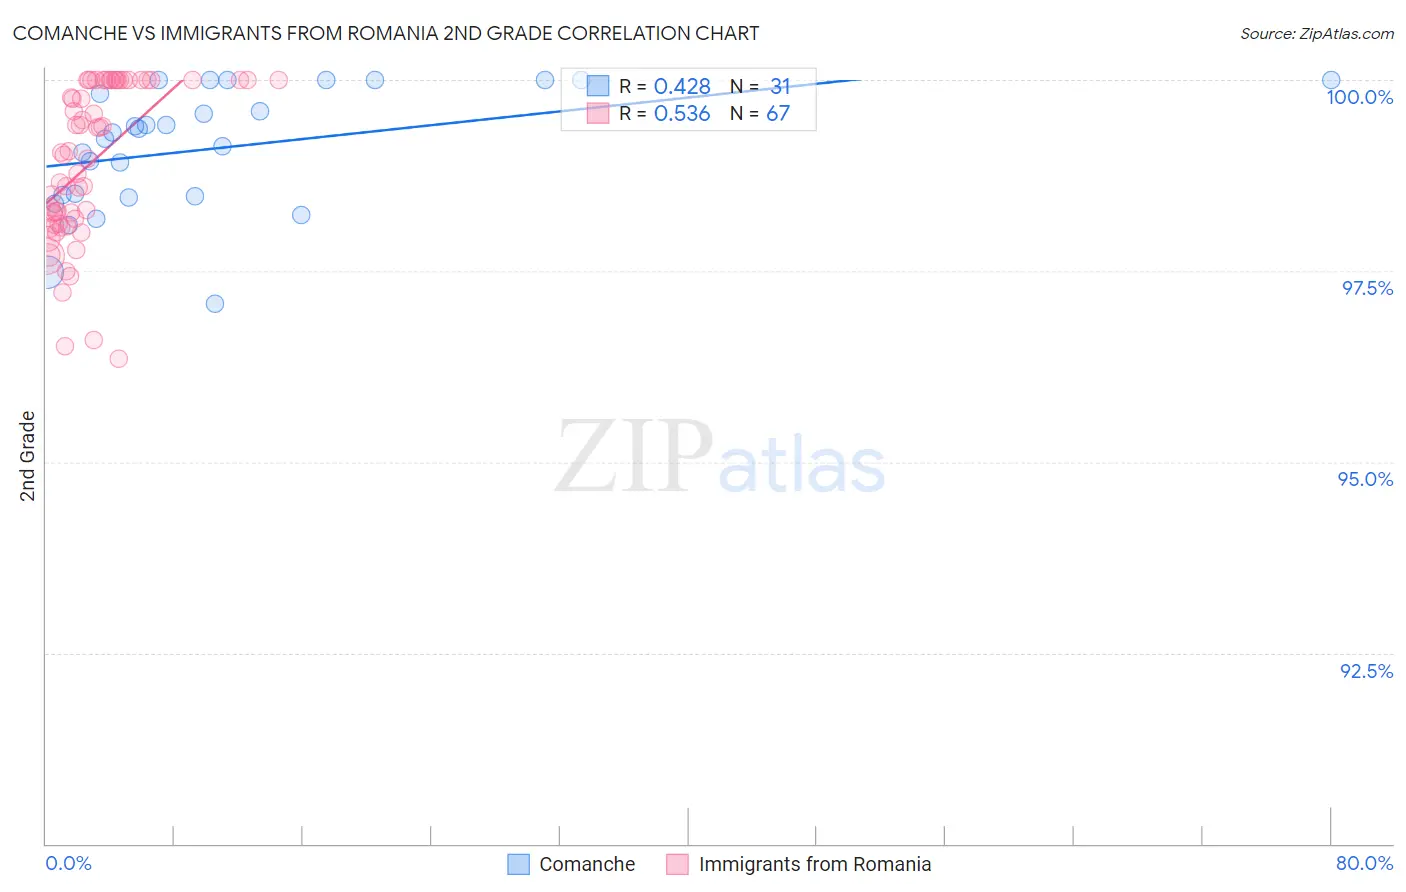
Comanche vs Immigrants from Romania 2nd Grade Correlation Chart
The statistical analysis conducted on geographies consisting of 109,786,530 people shows a moderate positive correlation between the proportion of Comanche and percentage of population with at least 2nd grade education in the United States with a correlation coefficient (R) of 0.428 and weighted average of 97.9%. Similarly, the statistical analysis conducted on geographies consisting of 257,006,599 people shows a substantial positive correlation between the proportion of Immigrants from Romania and percentage of population with at least 2nd grade education in the United States with a correlation coefficient (R) of 0.536 and weighted average of 98.0%, a difference of 0.12%.
2nd Grade Correlation Summary
| Measurement | Comanche | Immigrants from Romania |
| Minimum | 97.1% | 96.4% |
| Maximum | 100.0% | 100.0% |
| Range | 2.9% | 3.6% |
| Mean | 99.1% | 98.9% |
| Median | 99.3% | 99.1% |
| Interquartile 25% (IQ1) | 98.5% | 98.1% |
| Interquartile 75% (IQ3) | 100.0% | 100.0% |
| Interquartile Range (IQR) | 1.5% | 1.9% |
| Standard Deviation (Sample) | 0.80% | 1.0% |
| Standard Deviation (Population) | 0.79% | 1.0% |
Similar Demographics by 2nd Grade
Demographics Similar to Comanche by 2nd Grade
In terms of 2nd grade, the demographic groups most similar to Comanche are Dutch West Indian (97.9%, a difference of 0.0%), Venezuelan (97.9%, a difference of 0.0%), Immigrants from Iran (97.9%, a difference of 0.0%), French American Indian (97.9%, a difference of 0.010%), and Immigrants from Eastern Europe (97.9%, a difference of 0.010%).
| Demographics | Rating | Rank | 2nd Grade |
| Immigrants | North Macedonia | 68.5 /100 | #152 | Good 97.9% |
| Immigrants | South Central Asia | 68.3 /100 | #153 | Good 97.9% |
| Marshallese | 67.7 /100 | #154 | Good 97.9% |
| French American Indians | 64.3 /100 | #155 | Good 97.9% |
| Dutch West Indians | 63.8 /100 | #156 | Good 97.9% |
| Venezuelans | 63.3 /100 | #157 | Good 97.9% |
| Immigrants | Iran | 62.8 /100 | #158 | Good 97.9% |
| Comanche | 62.8 /100 | #159 | Good 97.9% |
| Immigrants | Eastern Europe | 61.1 /100 | #160 | Good 97.9% |
| Immigrants | Russia | 60.3 /100 | #161 | Good 97.9% |
| Immigrants | Italy | 60.2 /100 | #162 | Good 97.9% |
| Bermudans | 59.4 /100 | #163 | Average 97.9% |
| Ugandans | 56.6 /100 | #164 | Average 97.9% |
| Spanish Americans | 56.4 /100 | #165 | Average 97.9% |
| Immigrants | Jordan | 56.3 /100 | #166 | Average 97.9% |
Demographics Similar to Immigrants from Romania by 2nd Grade
In terms of 2nd grade, the demographic groups most similar to Immigrants from Romania are Israeli (98.0%, a difference of 0.0%), Immigrants from Hungary (98.0%, a difference of 0.010%), Immigrants from Bulgaria (98.0%, a difference of 0.010%), Immigrants from Kuwait (98.0%, a difference of 0.010%), and Blackfeet (98.0%, a difference of 0.010%).
| Demographics | Rating | Rank | 2nd Grade |
| Seminole | 91.1 /100 | #130 | Exceptional 98.0% |
| Immigrants | Europe | 91.1 /100 | #131 | Exceptional 98.0% |
| Spaniards | 90.7 /100 | #132 | Exceptional 98.0% |
| Cambodians | 90.7 /100 | #133 | Exceptional 98.0% |
| Immigrants | Hungary | 89.7 /100 | #134 | Excellent 98.0% |
| Immigrants | Bulgaria | 89.7 /100 | #135 | Excellent 98.0% |
| Immigrants | Kuwait | 89.2 /100 | #136 | Excellent 98.0% |
| Immigrants | Romania | 88.3 /100 | #137 | Excellent 98.0% |
| Israelis | 87.9 /100 | #138 | Excellent 98.0% |
| Blackfeet | 87.5 /100 | #139 | Excellent 98.0% |
| Palestinians | 83.9 /100 | #140 | Excellent 98.0% |
| Immigrants | Turkey | 83.0 /100 | #141 | Excellent 98.0% |
| Burmese | 81.0 /100 | #142 | Excellent 98.0% |
| Alsatians | 80.5 /100 | #143 | Excellent 98.0% |
| Hmong | 80.0 /100 | #144 | Good 98.0% |