Bolivian vs West Indian Professional Degree
COMPARE
Bolivian
West Indian
Professional Degree
Professional Degree Comparison
Bolivians
West Indians
5.6%
PROFESSIONAL DEGREE
99.9/ 100
METRIC RATING
60th/ 347
METRIC RANK
4.1%
PROFESSIONAL DEGREE
9.8/ 100
METRIC RATING
216th/ 347
METRIC RANK
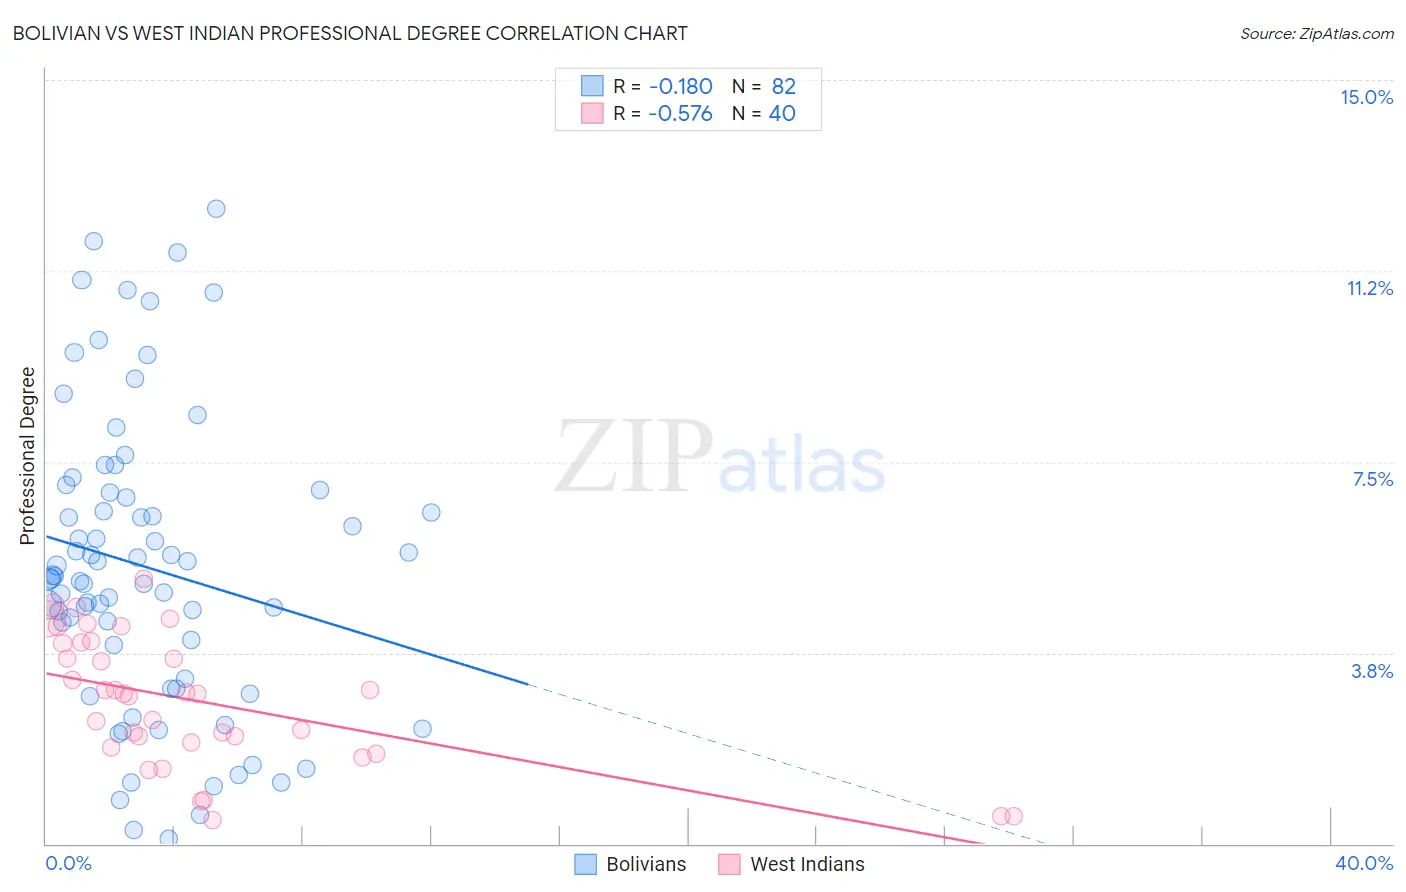
Bolivian vs West Indian Professional Degree Correlation Chart
The statistical analysis conducted on geographies consisting of 184,548,314 people shows a poor negative correlation between the proportion of Bolivians and percentage of population with at least professional degree education in the United States with a correlation coefficient (R) of -0.180 and weighted average of 5.6%. Similarly, the statistical analysis conducted on geographies consisting of 253,709,742 people shows a substantial negative correlation between the proportion of West Indians and percentage of population with at least professional degree education in the United States with a correlation coefficient (R) of -0.576 and weighted average of 4.1%, a difference of 38.5%.
Professional Degree Correlation Summary
| Measurement | Bolivian | West Indian |
| Minimum | 0.095% | 0.46% |
| Maximum | 12.5% | 5.2% |
| Range | 12.4% | 4.7% |
| Mean | 5.4% | 2.8% |
| Median | 5.2% | 2.9% |
| Interquartile 25% (IQ1) | 3.2% | 1.9% |
| Interquartile 75% (IQ3) | 6.9% | 3.9% |
| Interquartile Range (IQR) | 3.7% | 2.0% |
| Standard Deviation (Sample) | 2.9% | 1.3% |
| Standard Deviation (Population) | 2.9% | 1.3% |
Similar Demographics by Professional Degree
Demographics Similar to Bolivians by Professional Degree
In terms of professional degree, the demographic groups most similar to Bolivians are Immigrants from Europe (5.6%, a difference of 0.42%), Immigrants from Lithuania (5.6%, a difference of 0.65%), Bulgarian (5.7%, a difference of 0.94%), Immigrants from Belarus (5.5%, a difference of 1.4%), and South African (5.7%, a difference of 1.5%).
| Demographics | Rating | Rank | Professional Degree |
| Immigrants | Netherlands | 100.0 /100 | #53 | Exceptional 5.8% |
| Immigrants | Kuwait | 100.0 /100 | #54 | Exceptional 5.7% |
| Immigrants | Western Europe | 100.0 /100 | #55 | Exceptional 5.7% |
| Immigrants | Malaysia | 100.0 /100 | #56 | Exceptional 5.7% |
| South Africans | 100.0 /100 | #57 | Exceptional 5.7% |
| Bulgarians | 100.0 /100 | #58 | Exceptional 5.7% |
| Immigrants | Europe | 100.0 /100 | #59 | Exceptional 5.6% |
| Bolivians | 99.9 /100 | #60 | Exceptional 5.6% |
| Immigrants | Lithuania | 99.9 /100 | #61 | Exceptional 5.6% |
| Immigrants | Belarus | 99.9 /100 | #62 | Exceptional 5.5% |
| Asians | 99.9 /100 | #63 | Exceptional 5.5% |
| Immigrants | Asia | 99.9 /100 | #64 | Exceptional 5.5% |
| Immigrants | Bolivia | 99.9 /100 | #65 | Exceptional 5.5% |
| Immigrants | Kazakhstan | 99.9 /100 | #66 | Exceptional 5.5% |
| Immigrants | Bulgaria | 99.9 /100 | #67 | Exceptional 5.5% |
Demographics Similar to West Indians by Professional Degree
In terms of professional degree, the demographic groups most similar to West Indians are Immigrants from Vietnam (4.0%, a difference of 0.16%), Portuguese (4.1%, a difference of 0.31%), Immigrants from Ghana (4.1%, a difference of 0.37%), Dutch (4.0%, a difference of 0.37%), and Immigrants from South Eastern Asia (4.0%, a difference of 0.40%).
| Demographics | Rating | Rank | Professional Degree |
| Immigrants | Panama | 12.3 /100 | #209 | Poor 4.1% |
| Immigrants | Nigeria | 11.7 /100 | #210 | Poor 4.1% |
| Germans | 11.6 /100 | #211 | Poor 4.1% |
| Whites/Caucasians | 11.2 /100 | #212 | Poor 4.1% |
| Koreans | 10.7 /100 | #213 | Poor 4.1% |
| Immigrants | Ghana | 10.6 /100 | #214 | Poor 4.1% |
| Portuguese | 10.5 /100 | #215 | Poor 4.1% |
| West Indians | 9.8 /100 | #216 | Tragic 4.1% |
| Immigrants | Vietnam | 9.4 /100 | #217 | Tragic 4.0% |
| Dutch | 9.0 /100 | #218 | Tragic 4.0% |
| Immigrants | South Eastern Asia | 8.9 /100 | #219 | Tragic 4.0% |
| Ute | 8.2 /100 | #220 | Tragic 4.0% |
| French Canadians | 8.0 /100 | #221 | Tragic 4.0% |
| Immigrants | Western Africa | 7.5 /100 | #222 | Tragic 4.0% |
| Immigrants | Bosnia and Herzegovina | 7.4 /100 | #223 | Tragic 4.0% |