Bolivian vs Potawatomi Professional Degree

COMPARE

Bolivian
Race
Ancestry
AfghanAfricanAlaska NativeAlaskan AthabascanAlbanianAleutAlsatianAmericanApacheArabArapahoArgentineanArmenianAssyrian/Chaldean/SyriacAustralianAustrianBahamianBangladeshiBarbadianBasqueBelgianBelizeanBermudanBhutaneseBlackfeetBolivianBrazilianBritishBritish West IndianBulgarianBurmeseCajunCambodianCanadianCape VerdeanCarpatho RusynCelticCentral AmericanCentral American IndianCherokeeCheyenneChickasawChileanChineseChippewaChoctawColombianColvilleComancheCosta RicanCreeCreekCroatianCrowCubanCypriotCzechCzechoslovakianDanishDelawareDominicanDutchDutch West IndianEastern EuropeanEcuadorianEgyptianEnglishEstonianEthiopianEuropeanFijianFilipinoFinnishFrenchFrench American IndianFrench CanadianGermanGerman RussianGhanaianGreekGuamanian/ChamorroGuatemalanGuyaneseHaitianHmongHonduranHopiHoumaHungarianIcelanderIndian (Asian)IndonesianInupiatIranianIraqiIrishIroquoisIsraeliItalianJamaicanJapaneseJordanianKenyanKiowaKoreanLaotianLatvianLebaneseLiberianLithuanianLumbeeLuxembourgerMacedonianMalaysianMalteseMarshalleseMenomineeMexicanMexican American IndianMongolianMoroccanNative HawaiianNavajoNepaleseNew ZealanderNicaraguanNigerianNorthern EuropeanNorwegianOkinawanOsageOttawaPaiutePakistaniPalestinianPanamanianParaguayanPennsylvania GermanPeruvianPimaPolishPortuguesePuebloPuerto RicanPuget Sound SalishRomanianRussianSalvadoranSamoanScandinavianScotch-IrishScottishSeminoleSenegaleseSerbianShoshoneSierra LeoneanSiouxSlavicSlovakSloveneSomaliSouth AfricanSouth AmericanSouth American IndianSoviet UnionSpaniardSpanishSpanish AmericanSpanish American IndianSri LankanSubsaharan AfricanSudaneseSwedishSwissSyrianTaiwaneseThaiTlingit-HaidaTohono O'OdhamTonganTrinidadian and TobagonianTsimshianTurkishU.S. Virgin IslanderUgandanUkrainianUruguayanUteVenezuelanVietnameseWelshWest IndianYakamaYaquiYugoslavianYumanYup'ikZimbabwean
Immigration
NonimmigrantsImmigrantsAfghanistanAfricaAlbaniaArgentinaArmeniaAsiaAustraliaAustriaBahamasBangladeshBarbadosBelarusBelgiumBelizeBoliviaBosnia and HerzegovinaBrazilBulgariaBurma/MyanmarCabo VerdeCambodiaCameroonCanadaCaribbeanCentral AmericaChileChinaColombiaCongoCosta RicaCroatiaCubaCzechoslovakiaDenmarkDominicaDominican RepublicEastern AfricaEastern AsiaEastern EuropeEcuadorEgyptEl SalvadorEnglandEritreaEthiopiaEuropeFijiFranceGermanyGhanaGreeceGrenadaGuatemalaGuyanaHaitiHondurasHong KongHungaryIndiaIndonesiaIranIraqIrelandIsraelItalyJamaicaJapanJordanKazakhstanKenyaKoreaKuwaitLaosLatin AmericaLatviaLebanonLiberiaLithuaniaMalaysiaMexicoMicronesiaMiddle AfricaMoldovaMoroccoNepalNetherlandsNicaraguaNigeriaNorth AmericaNorth MacedoniaNorthern AfricaNorthern EuropeNorwayOceaniaPakistanPanamaPeruPhilippinesPolandPortugalRomaniaRussiaSaudi ArabiaScotlandSenegalSerbiaSierra LeoneSingaporeSomaliaSouth AfricaSouth AmericaSouth Central AsiaSouth Eastern AsiaSouthern EuropeSpainSri LankaSt. Vincent and the GrenadinesSudanSwedenSwitzerlandSyriaTaiwanThailandTrinidad and TobagoTurkeyUgandaUkraineUruguayUzbekistanVenezuelaVietnamWest IndiesWestern AfricaWestern AsiaWestern EuropeYemenZaireZimbabweAzores
Potawatomi
Race
Ancestry
AfghanAfricanAlaska NativeAlaskan AthabascanAlbanianAleutAlsatianAmericanApacheArabArapahoArgentineanArmenianAssyrian/Chaldean/SyriacAustralianAustrianBahamianBangladeshiBarbadianBasqueBelgianBelizeanBermudanBhutaneseBlackfeetBrazilianBritishBritish West IndianBulgarianBurmeseCajunCambodianCanadianCape VerdeanCarpatho RusynCelticCentral AmericanCentral American IndianCherokeeCheyenneChickasawChileanChineseChippewaChoctawColombianColvilleComancheCosta RicanCreeCreekCroatianCrowCubanCypriotCzechCzechoslovakianDanishDelawareDominicanDutchDutch West IndianEastern EuropeanEcuadorianEgyptianEnglishEstonianEthiopianEuropeanFijianFilipinoFinnishFrenchFrench American IndianFrench CanadianGermanGerman RussianGhanaianGreekGuamanian/ChamorroGuatemalanGuyaneseHaitianHmongHonduranHopiHoumaHungarianIcelanderIndian (Asian)IndonesianInupiatIranianIraqiIrishIroquoisIsraeliItalianJamaicanJapaneseJordanianKenyanKiowaKoreanLaotianLatvianLebaneseLiberianLithuanianLumbeeLuxembourgerMacedonianMalaysianMalteseMarshalleseMenomineeMexicanMexican American IndianMongolianMoroccanNative HawaiianNavajoNepaleseNew ZealanderNicaraguanNigerianNorthern EuropeanNorwegianOkinawanOsageOttawaPaiutePakistaniPalestinianPanamanianParaguayanPennsylvania GermanPeruvianPimaPolishPortuguesePotawatomiPuebloPuerto RicanPuget Sound SalishRomanianRussianSalvadoranSamoanScandinavianScotch-IrishScottishSeminoleSenegaleseSerbianShoshoneSierra LeoneanSiouxSlavicSlovakSloveneSomaliSouth AfricanSouth AmericanSouth American IndianSoviet UnionSpaniardSpanishSpanish AmericanSpanish American IndianSri LankanSubsaharan AfricanSudaneseSwedishSwissSyrianTaiwaneseThaiTlingit-HaidaTohono O'OdhamTonganTrinidadian and TobagonianTsimshianTurkishU.S. Virgin IslanderUgandanUkrainianUruguayanUteVenezuelanVietnameseWelshWest IndianYakamaYaquiYugoslavianYumanYup'ikZimbabwean
Immigration
NonimmigrantsImmigrantsAfghanistanAfricaAlbaniaArgentinaArmeniaAsiaAustraliaAustriaBahamasBangladeshBarbadosBelarusBelgiumBelizeBoliviaBosnia and HerzegovinaBrazilBulgariaBurma/MyanmarCabo VerdeCambodiaCameroonCanadaCaribbeanCentral AmericaChileChinaColombiaCongoCosta RicaCroatiaCubaCzechoslovakiaDenmarkDominicaDominican RepublicEastern AfricaEastern AsiaEastern EuropeEcuadorEgyptEl SalvadorEnglandEritreaEthiopiaEuropeFijiFranceGermanyGhanaGreeceGrenadaGuatemalaGuyanaHaitiHondurasHong KongHungaryIndiaIndonesiaIranIraqIrelandIsraelItalyJamaicaJapanJordanKazakhstanKenyaKoreaKuwaitLaosLatin AmericaLatviaLebanonLiberiaLithuaniaMalaysiaMexicoMicronesiaMiddle AfricaMoldovaMoroccoNepalNetherlandsNicaraguaNigeriaNorth AmericaNorth MacedoniaNorthern AfricaNorthern EuropeNorwayOceaniaPakistanPanamaPeruPhilippinesPolandPortugalRomaniaRussiaSaudi ArabiaScotlandSenegalSerbiaSierra LeoneSingaporeSomaliaSouth AfricaSouth AmericaSouth Central AsiaSouth Eastern AsiaSouthern EuropeSpainSri LankaSt. Vincent and the GrenadinesSudanSwedenSwitzerlandSyriaTaiwanThailandTrinidad and TobagoTurkeyUgandaUkraineUruguayUzbekistanVenezuelaVietnamWest IndiesWestern AfricaWestern AsiaWestern EuropeYemenZaireZimbabweAzores
Professional Degree
Income
Poverty
Unemployment
Labor Participation
Family Structure
Vehicle Availability
Education Level
Disability

Professional Degree Comparison

Bolivians

Potawatomi

Exceptional
Tragic
5.6%
PROFESSIONAL DEGREE
99.9/ 100
METRIC RATING
60th/ 347
METRIC RANK
3.6%
PROFESSIONAL DEGREE
0.5/ 100
METRIC RATING
274th/ 347
METRIC RANK

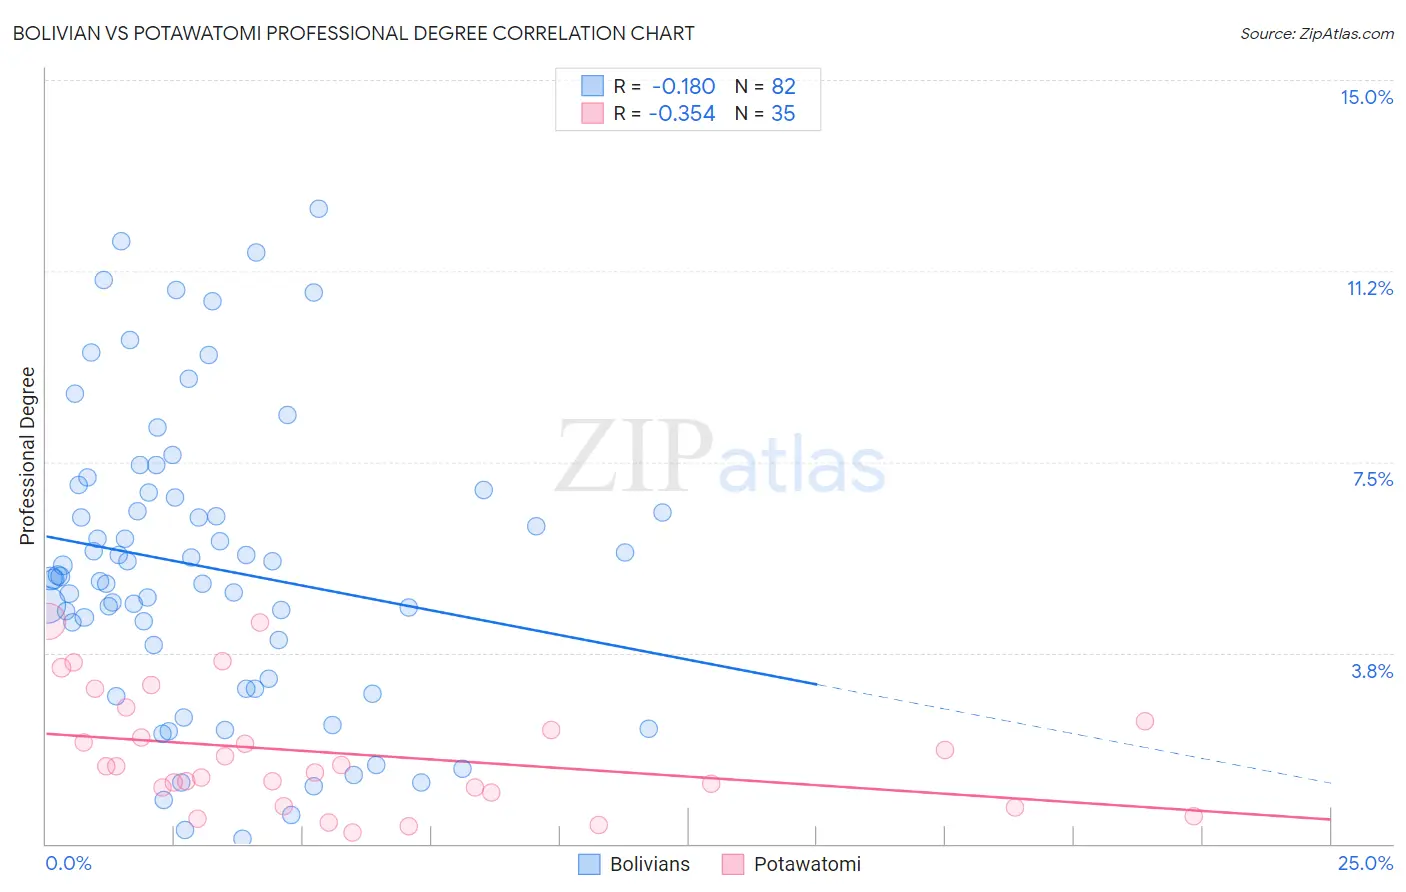
Bolivian vs Potawatomi Professional Degree Correlation Chart

The statistical analysis conducted on geographies consisting of 184,548,314 people shows a poor negative correlation between the proportion of Bolivians and percentage of population with at least professional degree education in the United States with a correlation coefficient (R) of -0.180 and weighted average of 5.6%. Similarly, the statistical analysis conducted on geographies consisting of 117,535,348 people shows a mild negative correlation between the proportion of Potawatomi and percentage of population with at least professional degree education in the United States with a correlation coefficient (R) of -0.354 and weighted average of 3.6%, a difference of 57.6%.
Bolivian vs Potawatomi Professional Degree

Professional Degree Correlation Summary

MeasurementBolivianPotawatomi
Minimum0.095%0.21%
Maximum12.5%4.4%
Range12.4%4.2%
Mean5.4%1.8%
Median5.2%1.5%
Interquartile 25% (IQ1)3.2%1.0%
Interquartile 75% (IQ3)6.9%2.4%
Interquartile Range (IQR)3.7%1.4%
Standard Deviation (Sample)2.9%1.1%
Standard Deviation (Population)2.9%1.1%

Similar Demographics by Professional Degree

Demographics Similar to Bolivians by Professional Degree

In terms of professional degree, the demographic groups most similar to Bolivians are Immigrants from Europe (5.6%, a difference of 0.42%), Immigrants from Lithuania (5.6%, a difference of 0.65%), Bulgarian (5.7%, a difference of 0.94%), Immigrants from Belarus (5.5%, a difference of 1.4%), and South African (5.7%, a difference of 1.5%).
DemographicsRating | RankProfessional Degree
Immigrants | Netherlands
100.0
/100
|
#53
Exceptional
5.8%
Immigrants | Kuwait
100.0
/100
|
#54
Exceptional
5.7%
Immigrants | Western Europe
100.0
/100
|
#55
Exceptional
5.7%
Immigrants | Malaysia
100.0
/100
|
#56
Exceptional
5.7%
South Africans
100.0
/100
|
#57
Exceptional
5.7%
Bulgarians
100.0
/100
|
#58
Exceptional
5.7%
Immigrants | Europe
100.0
/100
|
#59
Exceptional
5.6%
Bolivians
99.9
/100
|
#60
Exceptional
5.6%
Immigrants | Lithuania
99.9
/100
|
#61
Exceptional
5.6%
Immigrants | Belarus
99.9
/100
|
#62
Exceptional
5.5%
Asians
99.9
/100
|
#63
Exceptional
5.5%
Immigrants | Asia
99.9
/100
|
#64
Exceptional
5.5%
Immigrants | Bolivia
99.9
/100
|
#65
Exceptional
5.5%
Immigrants | Kazakhstan
99.9
/100
|
#66
Exceptional
5.5%
Immigrants | Bulgaria
99.9
/100
|
#67
Exceptional
5.5%

Demographics Similar to Potawatomi by Professional Degree

In terms of professional degree, the demographic groups most similar to Potawatomi are American (3.6%, a difference of 0.13%), Immigrants from Jamaica (3.6%, a difference of 0.19%), Belizean (3.6%, a difference of 0.22%), Immigrants from Dominica (3.6%, a difference of 0.23%), and Liberian (3.6%, a difference of 0.27%).
DemographicsRating | RankProfessional Degree
Delaware
0.7
/100
|
#267
Tragic
3.6%
Aleuts
0.7
/100
|
#268
Tragic
3.6%
Immigrants | Cuba
0.6
/100
|
#269
Tragic
3.6%
Central Americans
0.6
/100
|
#270
Tragic
3.6%
Belizeans
0.5
/100
|
#271
Tragic
3.6%
Immigrants | Jamaica
0.5
/100
|
#272
Tragic
3.6%
Americans
0.5
/100
|
#273
Tragic
3.6%
Potawatomi
0.5
/100
|
#274
Tragic
3.6%
Immigrants | Dominica
0.5
/100
|
#275
Tragic
3.6%
Liberians
0.5
/100
|
#276
Tragic
3.6%
Cheyenne
0.5
/100
|
#277
Tragic
3.6%
Japanese
0.5
/100
|
#278
Tragic
3.5%
Immigrants | Portugal
0.5
/100
|
#279
Tragic
3.5%
Dominicans
0.5
/100
|
#280
Tragic
3.5%
Apache
0.5
/100
|
#281
Tragic
3.5%