Brazilian vs Potawatomi Professional Degree
COMPARE
Brazilian
Potawatomi
Professional Degree
Professional Degree Comparison
Brazilians
Potawatomi
5.0%
PROFESSIONAL DEGREE
97.4/ 100
METRIC RATING
111th/ 347
METRIC RANK
3.6%
PROFESSIONAL DEGREE
0.5/ 100
METRIC RATING
274th/ 347
METRIC RANK
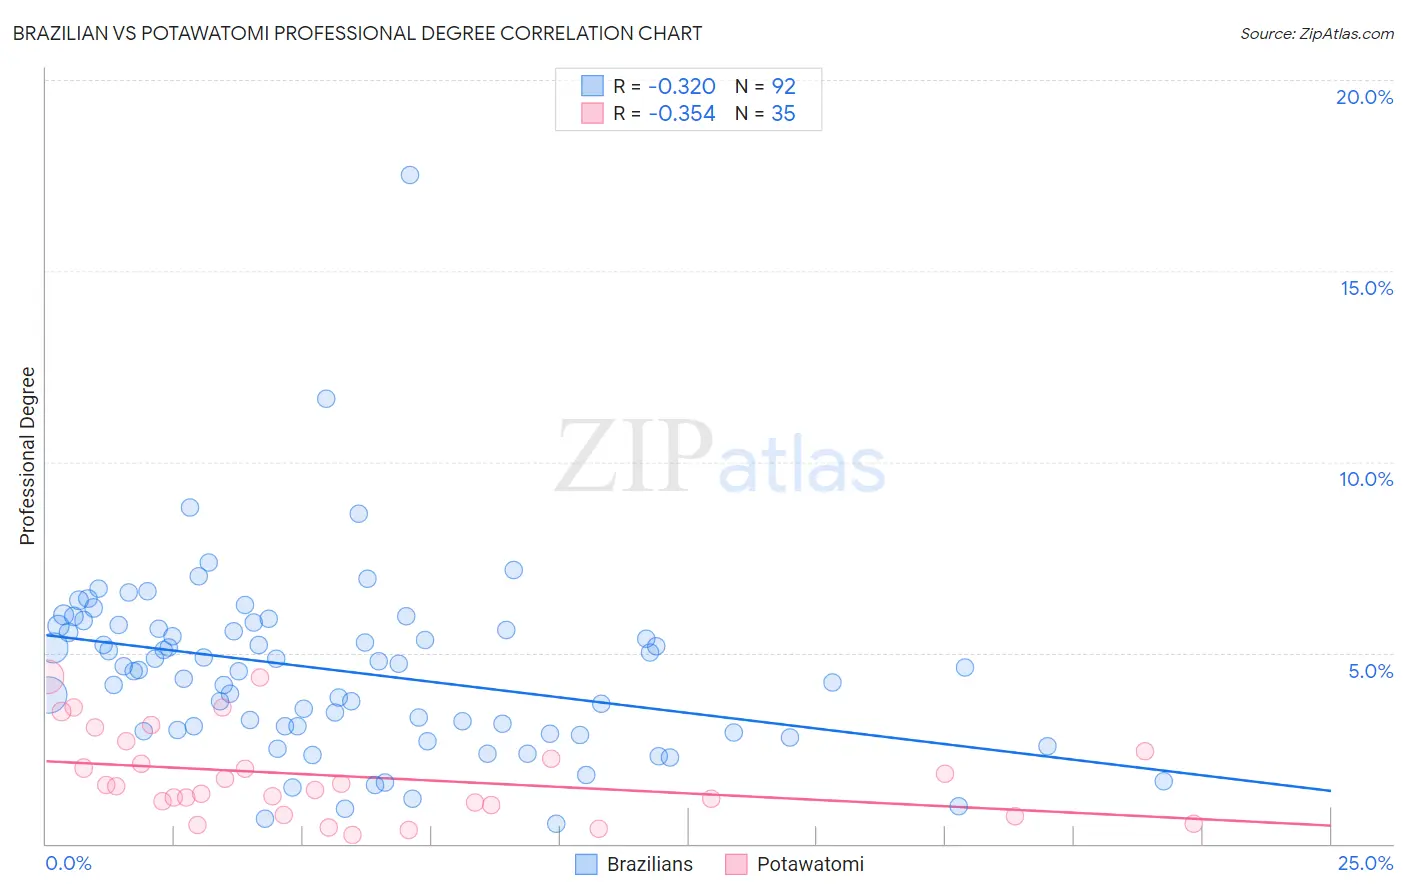
Brazilian vs Potawatomi Professional Degree Correlation Chart
The statistical analysis conducted on geographies consisting of 323,483,336 people shows a mild negative correlation between the proportion of Brazilians and percentage of population with at least professional degree education in the United States with a correlation coefficient (R) of -0.320 and weighted average of 5.0%. Similarly, the statistical analysis conducted on geographies consisting of 117,535,348 people shows a mild negative correlation between the proportion of Potawatomi and percentage of population with at least professional degree education in the United States with a correlation coefficient (R) of -0.354 and weighted average of 3.6%, a difference of 40.1%.
Professional Degree Correlation Summary
| Measurement | Brazilian | Potawatomi |
| Minimum | 0.54% | 0.21% |
| Maximum | 17.5% | 4.4% |
| Range | 17.0% | 4.2% |
| Mean | 4.5% | 1.8% |
| Median | 4.6% | 1.5% |
| Interquartile 25% (IQ1) | 3.0% | 1.0% |
| Interquartile 75% (IQ3) | 5.7% | 2.4% |
| Interquartile Range (IQR) | 2.7% | 1.4% |
| Standard Deviation (Sample) | 2.4% | 1.1% |
| Standard Deviation (Population) | 2.4% | 1.1% |
Similar Demographics by Professional Degree
Demographics Similar to Brazilians by Professional Degree
In terms of professional degree, the demographic groups most similar to Brazilians are Taiwanese (5.0%, a difference of 0.22%), Immigrants from Pakistan (5.0%, a difference of 0.24%), Immigrants from Morocco (5.0%, a difference of 0.69%), Lebanese (5.0%, a difference of 0.74%), and Moroccan (5.0%, a difference of 0.79%).
| Demographics | Rating | Rank | Professional Degree |
| Arabs | 98.2 /100 | #104 | Exceptional 5.0% |
| Immigrants | Uganda | 98.2 /100 | #105 | Exceptional 5.0% |
| Immigrants | Ukraine | 98.2 /100 | #106 | Exceptional 5.0% |
| Maltese | 98.1 /100 | #107 | Exceptional 5.0% |
| Immigrants | Southern Europe | 98.1 /100 | #108 | Exceptional 5.0% |
| British | 98.0 /100 | #109 | Exceptional 5.0% |
| Lebanese | 98.0 /100 | #110 | Exceptional 5.0% |
| Brazilians | 97.4 /100 | #111 | Exceptional 5.0% |
| Taiwanese | 97.3 /100 | #112 | Exceptional 5.0% |
| Immigrants | Pakistan | 97.2 /100 | #113 | Exceptional 5.0% |
| Immigrants | Morocco | 96.8 /100 | #114 | Exceptional 5.0% |
| Moroccans | 96.8 /100 | #115 | Exceptional 5.0% |
| Venezuelans | 96.3 /100 | #116 | Exceptional 4.9% |
| Immigrants | Syria | 96.0 /100 | #117 | Exceptional 4.9% |
| Croatians | 96.0 /100 | #118 | Exceptional 4.9% |
Demographics Similar to Potawatomi by Professional Degree
In terms of professional degree, the demographic groups most similar to Potawatomi are American (3.6%, a difference of 0.13%), Immigrants from Jamaica (3.6%, a difference of 0.19%), Belizean (3.6%, a difference of 0.22%), Immigrants from Dominica (3.6%, a difference of 0.23%), and Liberian (3.6%, a difference of 0.27%).
| Demographics | Rating | Rank | Professional Degree |
| Delaware | 0.7 /100 | #267 | Tragic 3.6% |
| Aleuts | 0.7 /100 | #268 | Tragic 3.6% |
| Immigrants | Cuba | 0.6 /100 | #269 | Tragic 3.6% |
| Central Americans | 0.6 /100 | #270 | Tragic 3.6% |
| Belizeans | 0.5 /100 | #271 | Tragic 3.6% |
| Immigrants | Jamaica | 0.5 /100 | #272 | Tragic 3.6% |
| Americans | 0.5 /100 | #273 | Tragic 3.6% |
| Potawatomi | 0.5 /100 | #274 | Tragic 3.6% |
| Immigrants | Dominica | 0.5 /100 | #275 | Tragic 3.6% |
| Liberians | 0.5 /100 | #276 | Tragic 3.6% |
| Cheyenne | 0.5 /100 | #277 | Tragic 3.6% |
| Japanese | 0.5 /100 | #278 | Tragic 3.5% |
| Immigrants | Portugal | 0.5 /100 | #279 | Tragic 3.5% |
| Dominicans | 0.5 /100 | #280 | Tragic 3.5% |
| Apache | 0.5 /100 | #281 | Tragic 3.5% |