Yakama vs Swedish No Schooling Completed
COMPARE
Yakama
Swedish
No Schooling Completed
No Schooling Completed Comparison
Yakama
Swedes
3.6%
NO SCHOOLING COMPLETED
0.0/ 100
METRIC RATING
339th/ 347
METRIC RANK
1.4%
NO SCHOOLING COMPLETED
100.0/ 100
METRIC RATING
8th/ 347
METRIC RANK
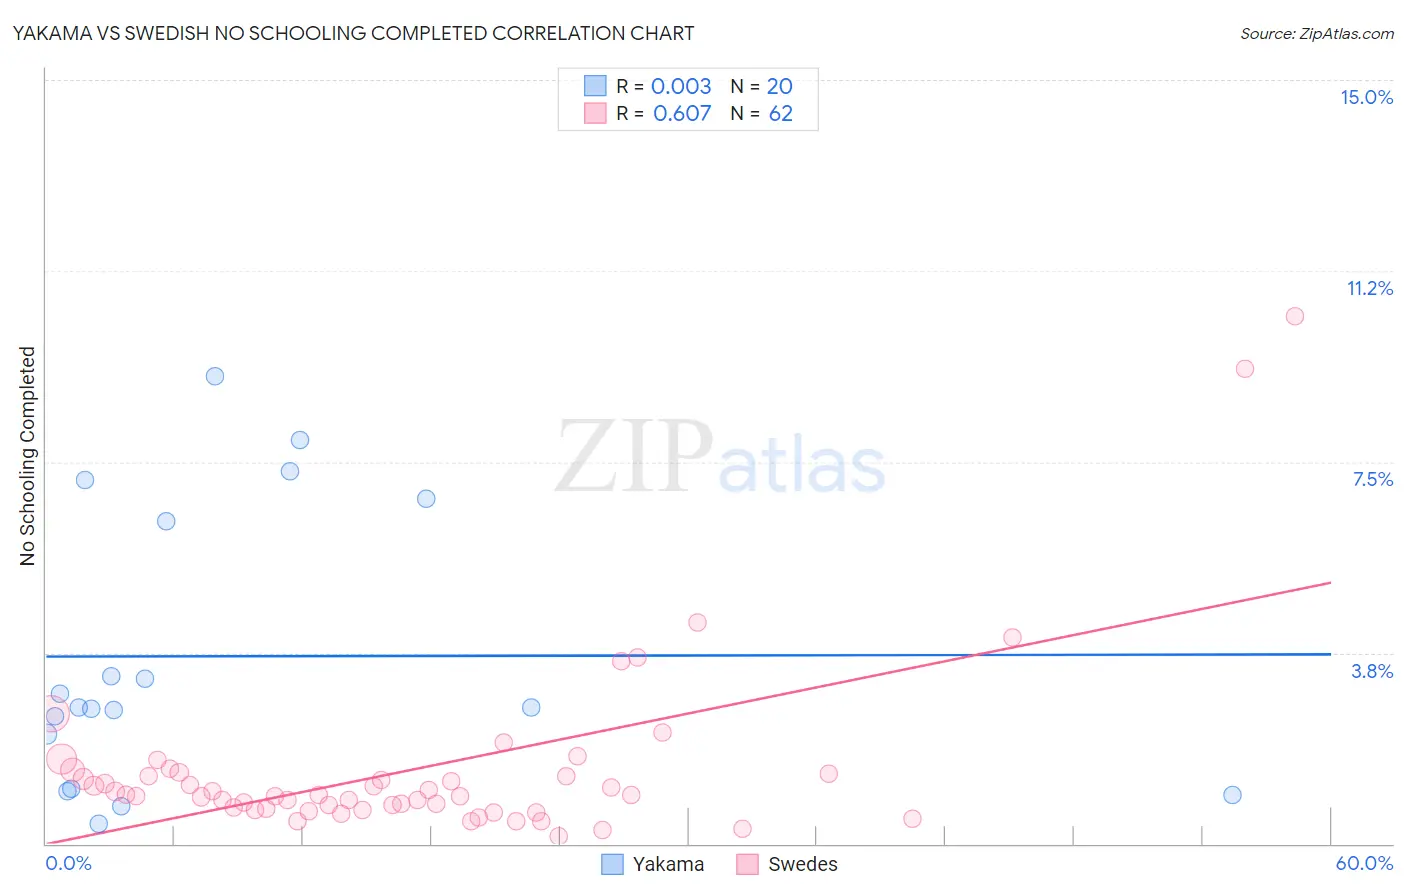
Yakama vs Swedish No Schooling Completed Correlation Chart
The statistical analysis conducted on geographies consisting of 19,822,084 people shows no correlation between the proportion of Yakama and percentage of population with no schooling in the United States with a correlation coefficient (R) of 0.003 and weighted average of 3.6%. Similarly, the statistical analysis conducted on geographies consisting of 523,541,764 people shows a significant positive correlation between the proportion of Swedes and percentage of population with no schooling in the United States with a correlation coefficient (R) of 0.607 and weighted average of 1.4%, a difference of 152.6%.
No Schooling Completed Correlation Summary
| Measurement | Yakama | Swedish |
| Minimum | 0.39% | 0.14% |
| Maximum | 9.2% | 10.4% |
| Range | 8.8% | 10.2% |
| Mean | 3.7% | 1.5% |
| Median | 2.7% | 0.96% |
| Interquartile 25% (IQ1) | 1.6% | 0.69% |
| Interquartile 75% (IQ3) | 6.6% | 1.4% |
| Interquartile Range (IQR) | 4.9% | 0.68% |
| Standard Deviation (Sample) | 2.7% | 1.8% |
| Standard Deviation (Population) | 2.6% | 1.8% |
Similar Demographics by No Schooling Completed
Demographics Similar to Yakama by No Schooling Completed
In terms of no schooling completed, the demographic groups most similar to Yakama are Bangladeshi (3.5%, a difference of 0.31%), Immigrants from Cabo Verde (3.5%, a difference of 0.55%), Immigrants from Guatemala (3.6%, a difference of 0.68%), Immigrants from Fiji (3.5%, a difference of 1.3%), and Immigrants from Cambodia (3.5%, a difference of 1.6%).
| Demographics | Rating | Rank | No Schooling Completed |
| Central Americans | 0.0 /100 | #332 | Tragic 3.4% |
| Immigrants | Dominican Republic | 0.0 /100 | #333 | Tragic 3.4% |
| Guatemalans | 0.0 /100 | #334 | Tragic 3.5% |
| Immigrants | Cambodia | 0.0 /100 | #335 | Tragic 3.5% |
| Immigrants | Fiji | 0.0 /100 | #336 | Tragic 3.5% |
| Immigrants | Cabo Verde | 0.0 /100 | #337 | Tragic 3.5% |
| Bangladeshis | 0.0 /100 | #338 | Tragic 3.5% |
| Yakama | 0.0 /100 | #339 | Tragic 3.6% |
| Immigrants | Guatemala | 0.0 /100 | #340 | Tragic 3.6% |
| Immigrants | Central America | 0.0 /100 | #341 | Tragic 3.6% |
| Immigrants | Mexico | 0.0 /100 | #342 | Tragic 3.6% |
| Salvadorans | 0.0 /100 | #343 | Tragic 3.7% |
| Nepalese | 0.0 /100 | #344 | Tragic 3.8% |
| Immigrants | El Salvador | 0.0 /100 | #345 | Tragic 3.9% |
| Immigrants | Yemen | 0.0 /100 | #346 | Tragic 4.1% |
Demographics Similar to Swedes by No Schooling Completed
In terms of no schooling completed, the demographic groups most similar to Swedes are Scottish (1.4%, a difference of 0.53%), Dutch (1.4%, a difference of 1.3%), English (1.4%, a difference of 1.5%), Lithuanian (1.4%, a difference of 2.2%), and Irish (1.4%, a difference of 2.2%).
| Demographics | Rating | Rank | No Schooling Completed |
| Yup'ik | 100.0 /100 | #1 | Exceptional 1.2% |
| Slovaks | 100.0 /100 | #2 | Exceptional 1.3% |
| Norwegians | 100.0 /100 | #3 | Exceptional 1.3% |
| Germans | 100.0 /100 | #4 | Exceptional 1.4% |
| Slovenes | 100.0 /100 | #5 | Exceptional 1.4% |
| Carpatho Rusyns | 100.0 /100 | #6 | Exceptional 1.4% |
| English | 100.0 /100 | #7 | Exceptional 1.4% |
| Swedes | 100.0 /100 | #8 | Exceptional 1.4% |
| Scottish | 100.0 /100 | #9 | Exceptional 1.4% |
| Dutch | 100.0 /100 | #10 | Exceptional 1.4% |
| Lithuanians | 100.0 /100 | #11 | Exceptional 1.4% |
| Irish | 100.0 /100 | #12 | Exceptional 1.4% |
| Poles | 100.0 /100 | #13 | Exceptional 1.4% |
| Scotch-Irish | 100.0 /100 | #14 | Exceptional 1.5% |
| Tlingit-Haida | 100.0 /100 | #15 | Exceptional 1.5% |