Barbadian vs Immigrants from Oceania Doctorate Degree
COMPARE
Barbadian
Immigrants from Oceania
Doctorate Degree
Doctorate Degree Comparison
Barbadians
Immigrants from Oceania
1.6%
DOCTORATE DEGREE
3.3/ 100
METRIC RATING
233rd/ 347
METRIC RANK
1.9%
DOCTORATE DEGREE
74.0/ 100
METRIC RATING
153rd/ 347
METRIC RANK
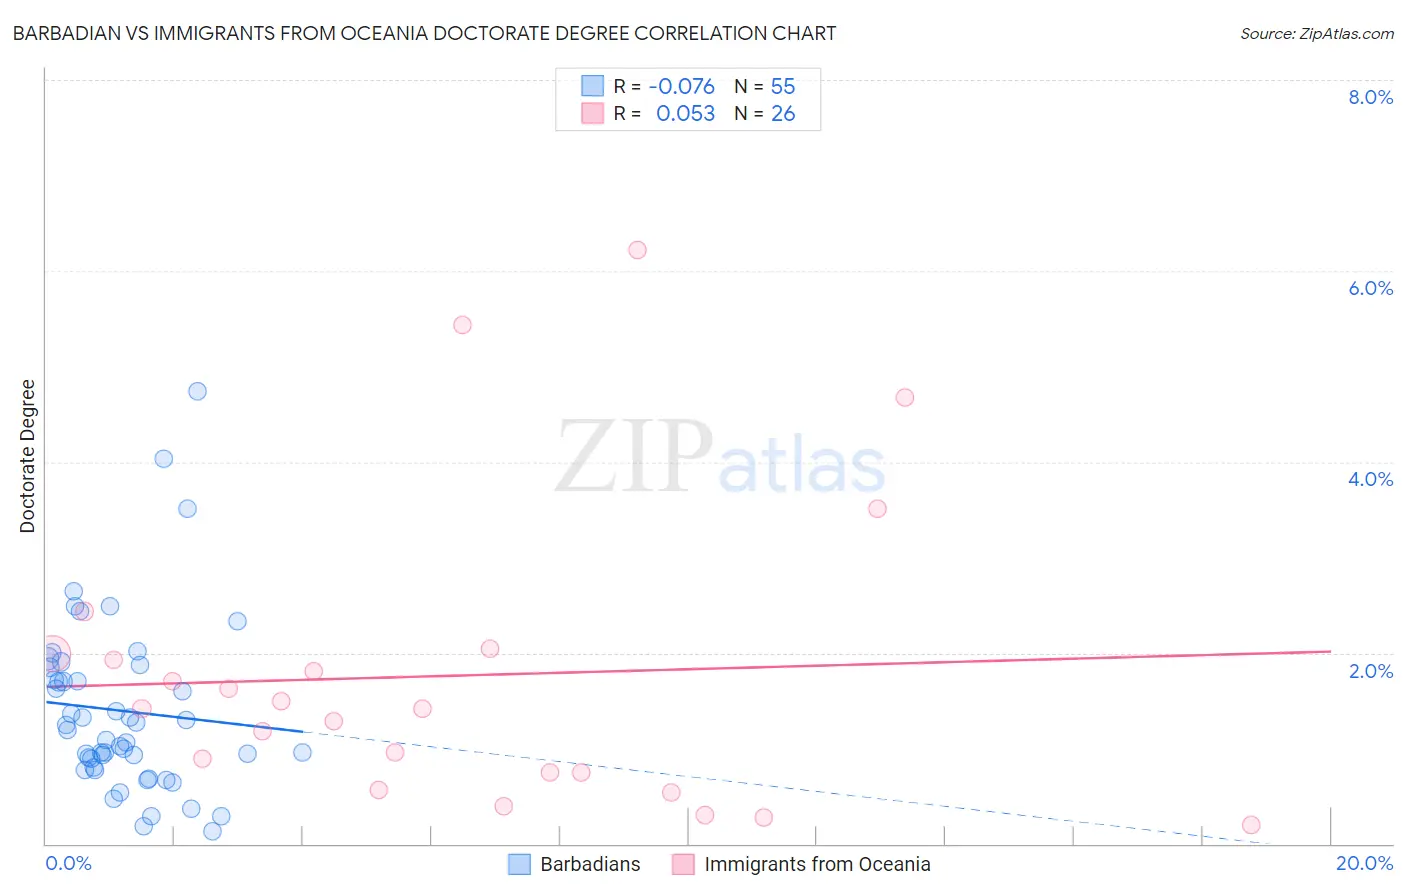
Barbadian vs Immigrants from Oceania Doctorate Degree Correlation Chart
The statistical analysis conducted on geographies consisting of 140,930,059 people shows a slight negative correlation between the proportion of Barbadians and percentage of population with at least doctorate degree education in the United States with a correlation coefficient (R) of -0.076 and weighted average of 1.6%. Similarly, the statistical analysis conducted on geographies consisting of 303,370,290 people shows a slight positive correlation between the proportion of Immigrants from Oceania and percentage of population with at least doctorate degree education in the United States with a correlation coefficient (R) of 0.053 and weighted average of 1.9%, a difference of 18.5%.
Doctorate Degree Correlation Summary
| Measurement | Barbadian | Immigrants from Oceania |
| Minimum | 0.13% | 0.19% |
| Maximum | 4.7% | 6.2% |
| Range | 4.6% | 6.0% |
| Mean | 1.4% | 1.8% |
| Median | 1.2% | 1.4% |
| Interquartile 25% (IQ1) | 0.80% | 0.75% |
| Interquartile 75% (IQ3) | 1.8% | 2.0% |
| Interquartile Range (IQR) | 1.1% | 1.2% |
| Standard Deviation (Sample) | 0.91% | 1.6% |
| Standard Deviation (Population) | 0.90% | 1.5% |
Similar Demographics by Doctorate Degree
Demographics Similar to Barbadians by Doctorate Degree
In terms of doctorate degree, the demographic groups most similar to Barbadians are Guamanian/Chamorro (1.6%, a difference of 0.070%), Hopi (1.6%, a difference of 0.15%), Cree (1.6%, a difference of 0.36%), Indonesian (1.6%, a difference of 0.64%), and Immigrants from North Macedonia (1.6%, a difference of 0.76%).
| Demographics | Rating | Rank | Doctorate Degree |
| Osage | 6.5 /100 | #226 | Tragic 1.7% |
| Panamanians | 6.3 /100 | #227 | Tragic 1.7% |
| Assyrians/Chaldeans/Syriacs | 5.9 /100 | #228 | Tragic 1.7% |
| Colville | 4.7 /100 | #229 | Tragic 1.6% |
| Immigrants | Philippines | 4.3 /100 | #230 | Tragic 1.6% |
| Immigrants | North Macedonia | 3.9 /100 | #231 | Tragic 1.6% |
| Guamanians/Chamorros | 3.3 /100 | #232 | Tragic 1.6% |
| Barbadians | 3.3 /100 | #233 | Tragic 1.6% |
| Hopi | 3.2 /100 | #234 | Tragic 1.6% |
| Cree | 3.0 /100 | #235 | Tragic 1.6% |
| Indonesians | 2.8 /100 | #236 | Tragic 1.6% |
| Iroquois | 2.7 /100 | #237 | Tragic 1.6% |
| Immigrants | Congo | 2.6 /100 | #238 | Tragic 1.6% |
| West Indians | 2.5 /100 | #239 | Tragic 1.6% |
| Immigrants | Panama | 2.4 /100 | #240 | Tragic 1.6% |
Demographics Similar to Immigrants from Oceania by Doctorate Degree
In terms of doctorate degree, the demographic groups most similar to Immigrants from Oceania are Immigrants from Kenya (1.9%, a difference of 0.050%), Albanian (1.9%, a difference of 0.15%), Immigrants from Albania (1.9%, a difference of 0.22%), Polish (1.9%, a difference of 0.24%), and Slavic (1.9%, a difference of 0.30%).
| Demographics | Rating | Rank | Doctorate Degree |
| Immigrants | Syria | 83.6 /100 | #146 | Excellent 1.9% |
| Immigrants | Senegal | 82.5 /100 | #147 | Excellent 1.9% |
| Luxembourgers | 81.1 /100 | #148 | Excellent 1.9% |
| Basques | 76.9 /100 | #149 | Good 1.9% |
| English | 75.9 /100 | #150 | Good 1.9% |
| Albanians | 74.8 /100 | #151 | Good 1.9% |
| Immigrants | Kenya | 74.3 /100 | #152 | Good 1.9% |
| Immigrants | Oceania | 74.0 /100 | #153 | Good 1.9% |
| Immigrants | Albania | 72.8 /100 | #154 | Good 1.9% |
| Poles | 72.7 /100 | #155 | Good 1.9% |
| Slavs | 72.4 /100 | #156 | Good 1.9% |
| Danes | 71.9 /100 | #157 | Good 1.9% |
| Hungarians | 71.7 /100 | #158 | Good 1.9% |
| Slovenes | 70.2 /100 | #159 | Good 1.9% |
| Welsh | 69.7 /100 | #160 | Good 1.9% |