Bangladeshi vs Scotch-Irish High School Diploma
COMPARE
Bangladeshi
Scotch-Irish
High School Diploma
High School Diploma Comparison
Bangladeshis
Scotch-Irish
86.9%
HIGH SCHOOL DIPLOMA
0.1/ 100
METRIC RATING
274th/ 347
METRIC RANK
90.8%
HIGH SCHOOL DIPLOMA
99.2/ 100
METRIC RATING
82nd/ 347
METRIC RANK
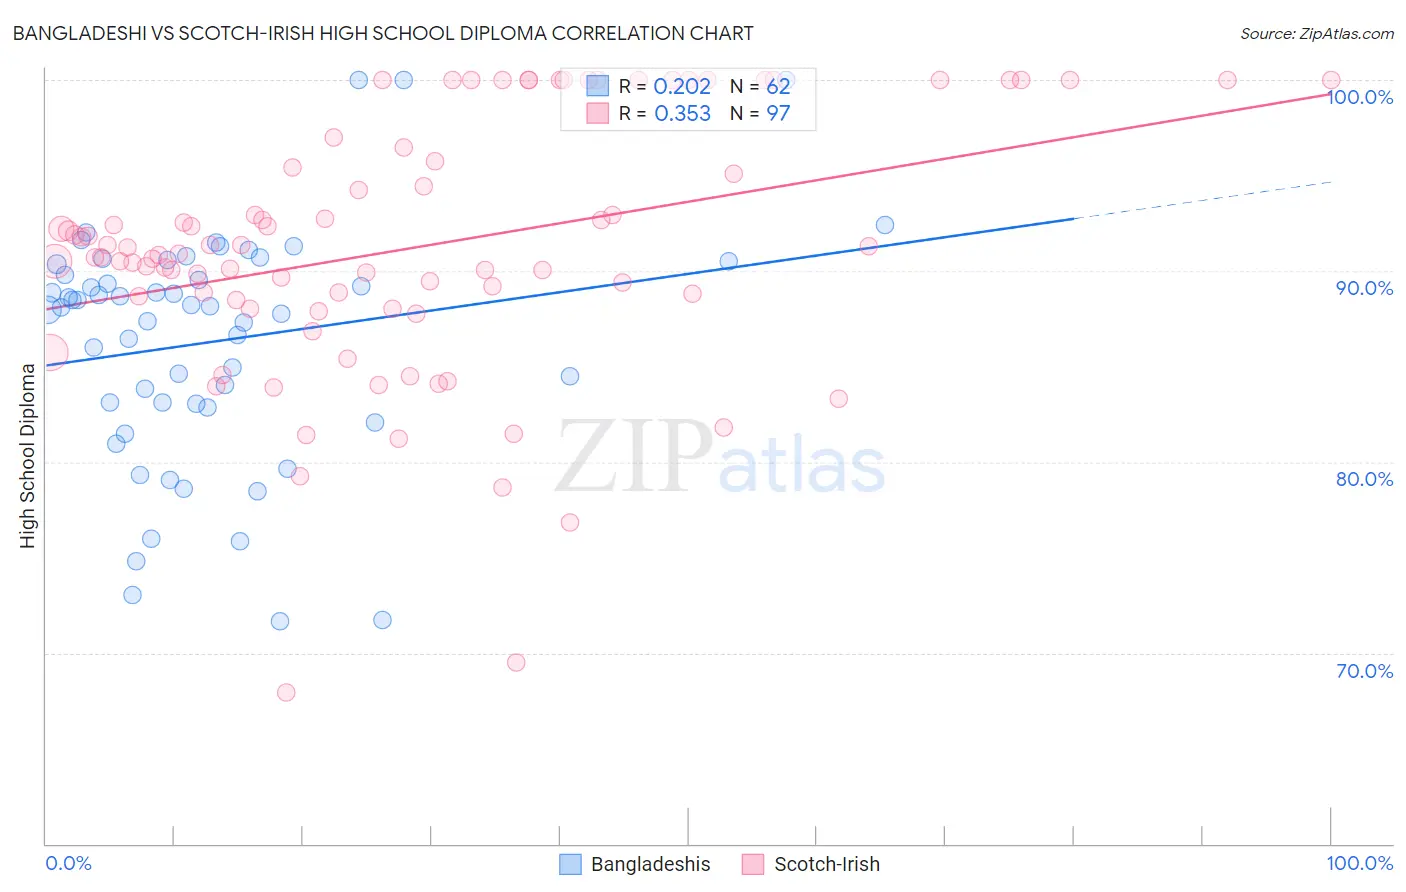
Bangladeshi vs Scotch-Irish High School Diploma Correlation Chart
The statistical analysis conducted on geographies consisting of 141,450,108 people shows a weak positive correlation between the proportion of Bangladeshis and percentage of population with at least high school diploma education in the United States with a correlation coefficient (R) of 0.202 and weighted average of 86.9%. Similarly, the statistical analysis conducted on geographies consisting of 548,780,422 people shows a mild positive correlation between the proportion of Scotch-Irish and percentage of population with at least high school diploma education in the United States with a correlation coefficient (R) of 0.353 and weighted average of 90.8%, a difference of 4.5%.
High School Diploma Correlation Summary
| Measurement | Bangladeshi | Scotch-Irish |
| Minimum | 71.7% | 67.9% |
| Maximum | 100.0% | 100.0% |
| Range | 28.3% | 32.1% |
| Mean | 86.3% | 91.2% |
| Median | 88.1% | 90.9% |
| Interquartile 25% (IQ1) | 83.1% | 88.2% |
| Interquartile 75% (IQ3) | 90.3% | 96.1% |
| Interquartile Range (IQR) | 7.3% | 7.9% |
| Standard Deviation (Sample) | 6.2% | 6.7% |
| Standard Deviation (Population) | 6.1% | 6.7% |
Similar Demographics by High School Diploma
Demographics Similar to Bangladeshis by High School Diploma
In terms of high school diploma, the demographic groups most similar to Bangladeshis are Immigrants from Jamaica (86.9%, a difference of 0.010%), Trinidadian and Tobagonian (86.9%, a difference of 0.040%), West Indian (86.9%, a difference of 0.050%), Malaysian (87.0%, a difference of 0.12%), and Sri Lankan (87.0%, a difference of 0.13%).
| Demographics | Rating | Rank | High School Diploma |
| Blacks/African Americans | 0.2 /100 | #267 | Tragic 87.0% |
| Pennsylvania Germans | 0.2 /100 | #268 | Tragic 87.0% |
| Sri Lankans | 0.2 /100 | #269 | Tragic 87.0% |
| Malaysians | 0.2 /100 | #270 | Tragic 87.0% |
| West Indians | 0.1 /100 | #271 | Tragic 86.9% |
| Trinidadians and Tobagonians | 0.1 /100 | #272 | Tragic 86.9% |
| Immigrants | Jamaica | 0.1 /100 | #273 | Tragic 86.9% |
| Bangladeshis | 0.1 /100 | #274 | Tragic 86.9% |
| Immigrants | Trinidad and Tobago | 0.1 /100 | #275 | Tragic 86.8% |
| Immigrants | Burma/Myanmar | 0.1 /100 | #276 | Tragic 86.7% |
| Barbadians | 0.1 /100 | #277 | Tragic 86.7% |
| Hopi | 0.1 /100 | #278 | Tragic 86.6% |
| Immigrants | Laos | 0.0 /100 | #279 | Tragic 86.6% |
| Pueblo | 0.0 /100 | #280 | Tragic 86.5% |
| Indonesians | 0.0 /100 | #281 | Tragic 86.5% |
Demographics Similar to Scotch-Irish by High School Diploma
In terms of high school diploma, the demographic groups most similar to Scotch-Irish are Immigrants from Moldova (90.7%, a difference of 0.020%), Immigrants from England (90.8%, a difference of 0.040%), Immigrants from Switzerland (90.8%, a difference of 0.040%), Immigrants from Denmark (90.8%, a difference of 0.050%), and Immigrants from Saudi Arabia (90.7%, a difference of 0.050%).
| Demographics | Rating | Rank | High School Diploma |
| Cambodians | 99.4 /100 | #75 | Exceptional 90.8% |
| Hungarians | 99.3 /100 | #76 | Exceptional 90.8% |
| Native Hawaiians | 99.3 /100 | #77 | Exceptional 90.8% |
| Burmese | 99.3 /100 | #78 | Exceptional 90.8% |
| Immigrants | Denmark | 99.3 /100 | #79 | Exceptional 90.8% |
| Immigrants | England | 99.3 /100 | #80 | Exceptional 90.8% |
| Immigrants | Switzerland | 99.3 /100 | #81 | Exceptional 90.8% |
| Scotch-Irish | 99.2 /100 | #82 | Exceptional 90.8% |
| Immigrants | Moldova | 99.2 /100 | #83 | Exceptional 90.7% |
| Immigrants | Saudi Arabia | 99.1 /100 | #84 | Exceptional 90.7% |
| Romanians | 98.9 /100 | #85 | Exceptional 90.7% |
| Immigrants | Bulgaria | 98.9 /100 | #86 | Exceptional 90.6% |
| Immigrants | Turkey | 98.9 /100 | #87 | Exceptional 90.6% |
| Immigrants | France | 98.8 /100 | #88 | Exceptional 90.6% |
| Canadians | 98.7 /100 | #89 | Exceptional 90.6% |