Mongolian vs Scotch-Irish High School Diploma
COMPARE
Mongolian
Scotch-Irish
High School Diploma
High School Diploma Comparison
Mongolians
Scotch-Irish
89.9%
HIGH SCHOOL DIPLOMA
91.6/ 100
METRIC RATING
124th/ 347
METRIC RANK
90.8%
HIGH SCHOOL DIPLOMA
99.2/ 100
METRIC RATING
82nd/ 347
METRIC RANK
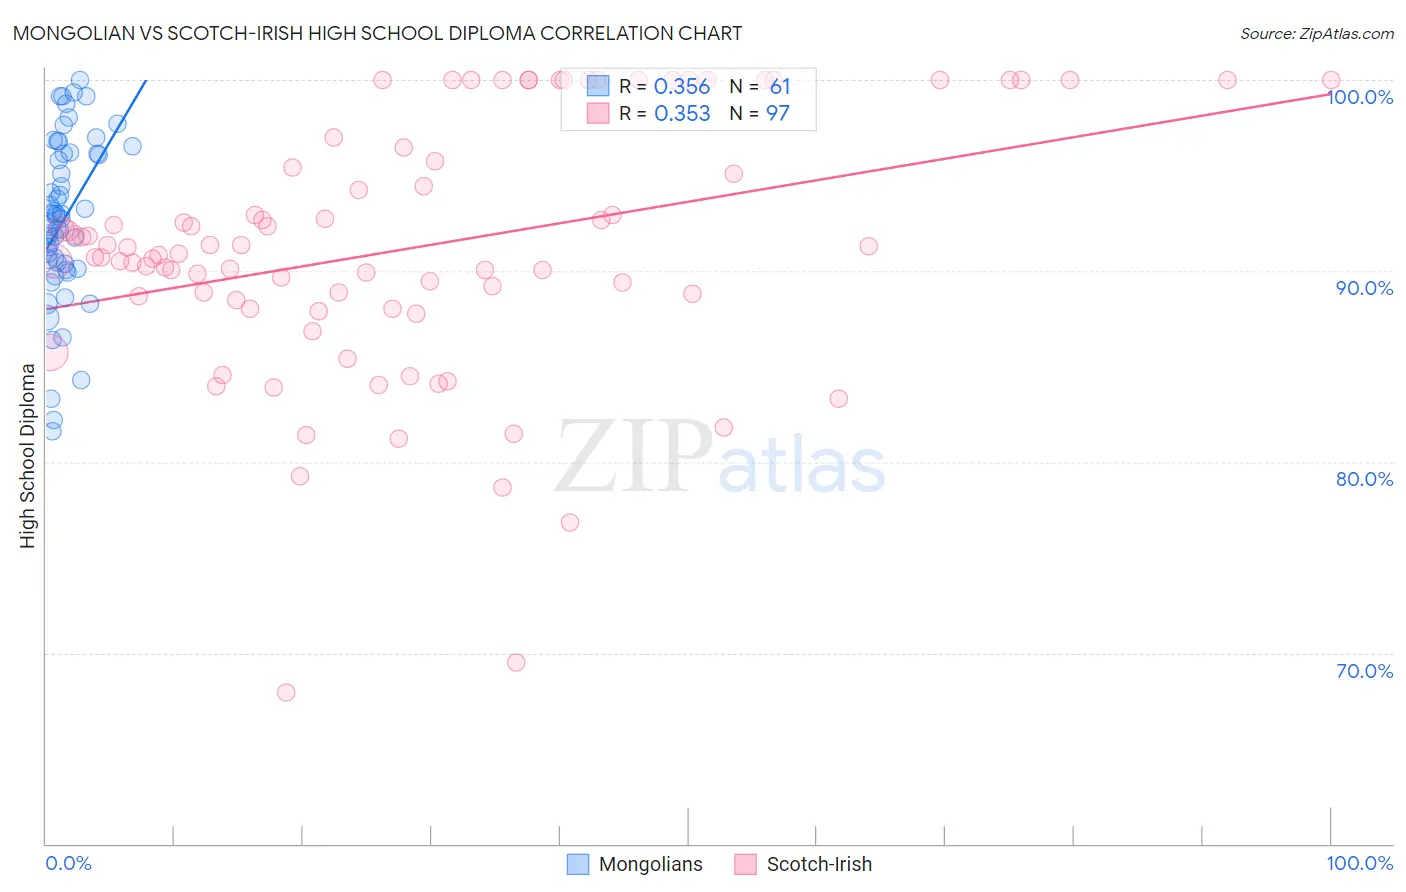
Mongolian vs Scotch-Irish High School Diploma Correlation Chart
The statistical analysis conducted on geographies consisting of 140,362,004 people shows a mild positive correlation between the proportion of Mongolians and percentage of population with at least high school diploma education in the United States with a correlation coefficient (R) of 0.356 and weighted average of 89.9%. Similarly, the statistical analysis conducted on geographies consisting of 548,780,422 people shows a mild positive correlation between the proportion of Scotch-Irish and percentage of population with at least high school diploma education in the United States with a correlation coefficient (R) of 0.353 and weighted average of 90.8%, a difference of 0.91%.
High School Diploma Correlation Summary
| Measurement | Mongolian | Scotch-Irish |
| Minimum | 81.6% | 67.9% |
| Maximum | 100.0% | 100.0% |
| Range | 18.4% | 32.1% |
| Mean | 92.7% | 91.2% |
| Median | 92.8% | 90.9% |
| Interquartile 25% (IQ1) | 90.2% | 88.2% |
| Interquartile 75% (IQ3) | 96.2% | 96.1% |
| Interquartile Range (IQR) | 6.0% | 7.9% |
| Standard Deviation (Sample) | 4.3% | 6.7% |
| Standard Deviation (Population) | 4.3% | 6.7% |
Similar Demographics by High School Diploma
Demographics Similar to Mongolians by High School Diploma
In terms of high school diploma, the demographic groups most similar to Mongolians are German Russian (90.0%, a difference of 0.020%), Egyptian (89.9%, a difference of 0.020%), Alaska Native (89.9%, a difference of 0.030%), Immigrants from Kazakhstan (90.0%, a difference of 0.10%), and Immigrants from Eastern Asia (89.9%, a difference of 0.10%).
| Demographics | Rating | Rank | High School Diploma |
| Jordanians | 95.4 /100 | #117 | Exceptional 90.2% |
| Israelis | 95.1 /100 | #118 | Exceptional 90.1% |
| Immigrants | Eastern Europe | 94.9 /100 | #119 | Exceptional 90.1% |
| Ottawa | 94.4 /100 | #120 | Exceptional 90.1% |
| Whites/Caucasians | 94.1 /100 | #121 | Exceptional 90.1% |
| Immigrants | Kazakhstan | 93.4 /100 | #122 | Exceptional 90.0% |
| German Russians | 92.0 /100 | #123 | Exceptional 90.0% |
| Mongolians | 91.6 /100 | #124 | Exceptional 89.9% |
| Egyptians | 91.1 /100 | #125 | Exceptional 89.9% |
| Alaska Natives | 91.0 /100 | #126 | Exceptional 89.9% |
| Immigrants | Eastern Asia | 89.2 /100 | #127 | Excellent 89.9% |
| Puget Sound Salish | 89.1 /100 | #128 | Excellent 89.9% |
| Basques | 88.5 /100 | #129 | Excellent 89.8% |
| Immigrants | Ukraine | 87.9 /100 | #130 | Excellent 89.8% |
| Immigrants | Italy | 87.4 /100 | #131 | Excellent 89.8% |
Demographics Similar to Scotch-Irish by High School Diploma
In terms of high school diploma, the demographic groups most similar to Scotch-Irish are Immigrants from Moldova (90.7%, a difference of 0.020%), Immigrants from England (90.8%, a difference of 0.040%), Immigrants from Switzerland (90.8%, a difference of 0.040%), Immigrants from Denmark (90.8%, a difference of 0.050%), and Immigrants from Saudi Arabia (90.7%, a difference of 0.050%).
| Demographics | Rating | Rank | High School Diploma |
| Cambodians | 99.4 /100 | #75 | Exceptional 90.8% |
| Hungarians | 99.3 /100 | #76 | Exceptional 90.8% |
| Native Hawaiians | 99.3 /100 | #77 | Exceptional 90.8% |
| Burmese | 99.3 /100 | #78 | Exceptional 90.8% |
| Immigrants | Denmark | 99.3 /100 | #79 | Exceptional 90.8% |
| Immigrants | England | 99.3 /100 | #80 | Exceptional 90.8% |
| Immigrants | Switzerland | 99.3 /100 | #81 | Exceptional 90.8% |
| Scotch-Irish | 99.2 /100 | #82 | Exceptional 90.8% |
| Immigrants | Moldova | 99.2 /100 | #83 | Exceptional 90.7% |
| Immigrants | Saudi Arabia | 99.1 /100 | #84 | Exceptional 90.7% |
| Romanians | 98.9 /100 | #85 | Exceptional 90.7% |
| Immigrants | Bulgaria | 98.9 /100 | #86 | Exceptional 90.6% |
| Immigrants | Turkey | 98.9 /100 | #87 | Exceptional 90.6% |
| Immigrants | France | 98.8 /100 | #88 | Exceptional 90.6% |
| Canadians | 98.7 /100 | #89 | Exceptional 90.6% |