Immigrants from Uruguay vs Scotch-Irish High School Diploma

COMPARE

Immigrants from Uruguay
Race
Ancestry
AfghanAfricanAlaska NativeAlaskan AthabascanAlbanianAleutAlsatianAmericanApacheArabArapahoArgentineanArmenianAssyrian/Chaldean/SyriacAustralianAustrianBahamianBangladeshiBarbadianBasqueBelgianBelizeanBermudanBhutaneseBlackfeetBolivianBrazilianBritishBritish West IndianBulgarianBurmeseCajunCambodianCanadianCape VerdeanCarpatho RusynCelticCentral AmericanCentral American IndianCherokeeCheyenneChickasawChileanChineseChippewaChoctawColombianColvilleComancheCosta RicanCreeCreekCroatianCrowCubanCypriotCzechCzechoslovakianDanishDelawareDominicanDutchDutch West IndianEastern EuropeanEcuadorianEgyptianEnglishEstonianEthiopianEuropeanFijianFilipinoFinnishFrenchFrench American IndianFrench CanadianGermanGerman RussianGhanaianGreekGuamanian/ChamorroGuatemalanGuyaneseHaitianHmongHonduranHopiHoumaHungarianIcelanderIndian (Asian)IndonesianInupiatIranianIraqiIrishIroquoisIsraeliItalianJamaicanJapaneseJordanianKenyanKiowaKoreanLaotianLatvianLebaneseLiberianLithuanianLumbeeLuxembourgerMacedonianMalaysianMalteseMarshalleseMenomineeMexicanMexican American IndianMongolianMoroccanNative HawaiianNavajoNepaleseNew ZealanderNicaraguanNigerianNorthern EuropeanNorwegianOkinawanOsageOttawaPaiutePakistaniPalestinianPanamanianParaguayanPennsylvania GermanPeruvianPimaPolishPortuguesePotawatomiPuebloPuerto RicanPuget Sound SalishRomanianRussianSalvadoranSamoanScandinavianScottishSeminoleSenegaleseSerbianShoshoneSierra LeoneanSiouxSlavicSlovakSloveneSomaliSouth AfricanSouth AmericanSouth American IndianSoviet UnionSpaniardSpanishSpanish AmericanSpanish American IndianSri LankanSubsaharan AfricanSudaneseSwedishSwissSyrianTaiwaneseThaiTlingit-HaidaTohono O'OdhamTonganTrinidadian and TobagonianTsimshianTurkishU.S. Virgin IslanderUgandanUkrainianUruguayanUteVenezuelanVietnameseWelshWest IndianYakamaYaquiYugoslavianYumanYup'ikZimbabwean
Immigration
NonimmigrantsImmigrantsAfghanistanAfricaAlbaniaArgentinaArmeniaAsiaAustraliaAustriaBahamasBangladeshBarbadosBelarusBelgiumBelizeBoliviaBosnia and HerzegovinaBrazilBulgariaBurma/MyanmarCabo VerdeCambodiaCameroonCanadaCaribbeanCentral AmericaChileChinaColombiaCongoCosta RicaCroatiaCubaCzechoslovakiaDenmarkDominicaDominican RepublicEastern AfricaEastern AsiaEastern EuropeEcuadorEgyptEl SalvadorEnglandEritreaEthiopiaEuropeFijiFranceGermanyGhanaGreeceGrenadaGuatemalaGuyanaHaitiHondurasHong KongHungaryIndiaIndonesiaIranIraqIrelandIsraelItalyJamaicaJapanJordanKazakhstanKenyaKoreaKuwaitLaosLatin AmericaLatviaLebanonLiberiaLithuaniaMalaysiaMexicoMicronesiaMiddle AfricaMoldovaMoroccoNepalNetherlandsNicaraguaNigeriaNorth AmericaNorth MacedoniaNorthern AfricaNorthern EuropeNorwayOceaniaPakistanPanamaPeruPhilippinesPolandPortugalRomaniaRussiaSaudi ArabiaScotlandSenegalSerbiaSierra LeoneSingaporeSomaliaSouth AfricaSouth AmericaSouth Central AsiaSouth Eastern AsiaSouthern EuropeSpainSri LankaSt. Vincent and the GrenadinesSudanSwedenSwitzerlandSyriaTaiwanThailandTrinidad and TobagoTurkeyUgandaUkraineUruguayUzbekistanVenezuelaVietnamWest IndiesWestern AfricaWestern AsiaWestern EuropeYemenZaireZimbabweAzores
Scotch-Irish
Race
Ancestry
AfghanAfricanAlaska NativeAlaskan AthabascanAlbanianAleutAlsatianAmericanApacheArabArapahoArgentineanArmenianAssyrian/Chaldean/SyriacAustralianAustrianBahamianBangladeshiBarbadianBasqueBelgianBelizeanBermudanBhutaneseBlackfeetBolivianBrazilianBritishBritish West IndianBulgarianBurmeseCajunCambodianCanadianCape VerdeanCarpatho RusynCelticCentral AmericanCentral American IndianCherokeeCheyenneChickasawChileanChineseChippewaChoctawColombianColvilleComancheCosta RicanCreeCreekCroatianCrowCubanCypriotCzechCzechoslovakianDanishDelawareDominicanDutchDutch West IndianEastern EuropeanEcuadorianEgyptianEnglishEstonianEthiopianEuropeanFijianFilipinoFinnishFrenchFrench American IndianFrench CanadianGermanGerman RussianGhanaianGreekGuamanian/ChamorroGuatemalanGuyaneseHaitianHmongHonduranHopiHoumaHungarianIcelanderIndian (Asian)IndonesianInupiatIranianIraqiIrishIroquoisIsraeliItalianJamaicanJapaneseJordanianKenyanKiowaKoreanLaotianLatvianLebaneseLiberianLithuanianLumbeeLuxembourgerMacedonianMalaysianMalteseMarshalleseMenomineeMexicanMexican American IndianMongolianMoroccanNative HawaiianNavajoNepaleseNew ZealanderNicaraguanNigerianNorthern EuropeanNorwegianOkinawanOsageOttawaPaiutePakistaniPalestinianPanamanianParaguayanPennsylvania GermanPeruvianPimaPolishPortuguesePotawatomiPuebloPuerto RicanPuget Sound SalishRomanianRussianSalvadoranSamoanScandinavianScotch-IrishScottishSeminoleSenegaleseSerbianShoshoneSierra LeoneanSiouxSlavicSlovakSloveneSomaliSouth AfricanSouth AmericanSouth American IndianSoviet UnionSpaniardSpanishSpanish AmericanSpanish American IndianSri LankanSubsaharan AfricanSudaneseSwedishSwissSyrianTaiwaneseThaiTlingit-HaidaTohono O'OdhamTonganTrinidadian and TobagonianTsimshianTurkishU.S. Virgin IslanderUgandanUkrainianUruguayanUteVenezuelanVietnameseWelshWest IndianYakamaYaquiYugoslavianYumanYup'ikZimbabwean
Immigration
NonimmigrantsImmigrantsAfghanistanAfricaAlbaniaArgentinaArmeniaAsiaAustraliaAustriaBahamasBangladeshBarbadosBelarusBelgiumBelizeBoliviaBosnia and HerzegovinaBrazilBulgariaBurma/MyanmarCabo VerdeCambodiaCameroonCanadaCaribbeanCentral AmericaChileChinaColombiaCongoCosta RicaCroatiaCubaCzechoslovakiaDenmarkDominicaDominican RepublicEastern AfricaEastern AsiaEastern EuropeEcuadorEgyptEl SalvadorEnglandEritreaEthiopiaEuropeFijiFranceGermanyGhanaGreeceGrenadaGuatemalaGuyanaHaitiHondurasHong KongHungaryIndiaIndonesiaIranIraqIrelandIsraelItalyJamaicaJapanJordanKazakhstanKenyaKoreaKuwaitLaosLatin AmericaLatviaLebanonLiberiaLithuaniaMalaysiaMexicoMicronesiaMiddle AfricaMoldovaMoroccoNepalNetherlandsNicaraguaNigeriaNorth AmericaNorth MacedoniaNorthern AfricaNorthern EuropeNorwayOceaniaPakistanPanamaPeruPhilippinesPolandPortugalRomaniaRussiaSaudi ArabiaScotlandSenegalSerbiaSierra LeoneSingaporeSomaliaSouth AfricaSouth AmericaSouth Central AsiaSouth Eastern AsiaSouthern EuropeSpainSri LankaSt. Vincent and the GrenadinesSudanSwedenSwitzerlandSyriaTaiwanThailandTrinidad and TobagoTurkeyUgandaUkraineUzbekistanVenezuelaVietnamWest IndiesWestern AfricaWestern AsiaWestern EuropeYemenZaireZimbabweAzores
High School Diploma
Income
Poverty
Unemployment
Labor Participation
Family Structure
Vehicle Availability
Education Level
Disability

High School Diploma Comparison

Immigrants from Uruguay

Scotch-Irish

Tragic
Exceptional
87.6%
HIGH SCHOOL DIPLOMA
1.0/ 100
METRIC RATING
253rd/ 347
METRIC RANK
90.8%
HIGH SCHOOL DIPLOMA
99.2/ 100
METRIC RATING
82nd/ 347
METRIC RANK

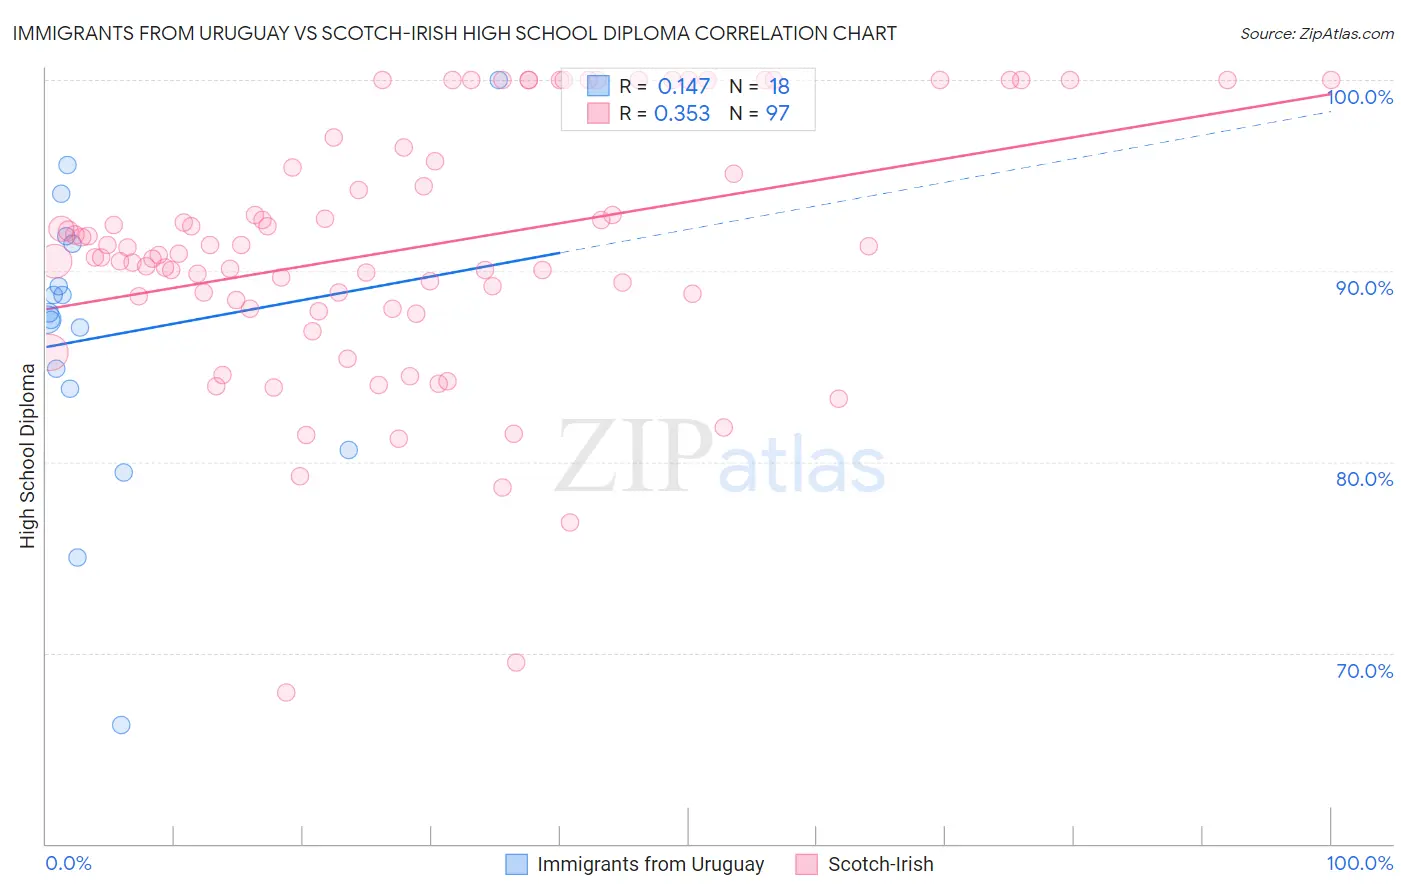
Immigrants from Uruguay vs Scotch-Irish High School Diploma Correlation Chart

The statistical analysis conducted on geographies consisting of 133,259,667 people shows a poor positive correlation between the proportion of Immigrants from Uruguay and percentage of population with at least high school diploma education in the United States with a correlation coefficient (R) of 0.147 and weighted average of 87.6%. Similarly, the statistical analysis conducted on geographies consisting of 548,780,422 people shows a mild positive correlation between the proportion of Scotch-Irish and percentage of population with at least high school diploma education in the United States with a correlation coefficient (R) of 0.353 and weighted average of 90.8%, a difference of 3.6%.
Immigrants from Uruguay vs Scotch-Irish High School Diploma

High School Diploma Correlation Summary

MeasurementImmigrants from UruguayScotch-Irish
Minimum66.2%67.9%
Maximum100.0%100.0%
Range33.8%32.1%
Mean86.6%91.2%
Median87.6%90.9%
Interquartile 25% (IQ1)83.8%88.2%
Interquartile 75% (IQ3)91.4%96.1%
Interquartile Range (IQR)7.6%7.9%
Standard Deviation (Sample)7.8%6.7%
Standard Deviation (Population)7.6%6.7%

Similar Demographics by High School Diploma

Demographics Similar to Immigrants from Uruguay by High School Diploma

In terms of high school diploma, the demographic groups most similar to Immigrants from Uruguay are Immigrants from Colombia (87.6%, a difference of 0.010%), Immigrants from South America (87.6%, a difference of 0.050%), Immigrants from Senegal (87.6%, a difference of 0.060%), Ghanaian (87.7%, a difference of 0.11%), and Senegalese (87.7%, a difference of 0.15%).
DemographicsRating | RankHigh School Diploma
Immigrants | Eritrea
1.7
/100
|
#246
Tragic
87.8%
Immigrants | Costa Rica
1.7
/100
|
#247
Tragic
87.8%
Spanish Americans
1.5
/100
|
#248
Tragic
87.7%
Senegalese
1.5
/100
|
#249
Tragic
87.7%
Immigrants | Nigeria
1.5
/100
|
#250
Tragic
87.7%
Ghanaians
1.4
/100
|
#251
Tragic
87.7%
Immigrants | South America
1.2
/100
|
#252
Tragic
87.6%
Immigrants | Uruguay
1.0
/100
|
#253
Tragic
87.6%
Immigrants | Colombia
1.0
/100
|
#254
Tragic
87.6%
Immigrants | Senegal
0.9
/100
|
#255
Tragic
87.6%
Africans
0.7
/100
|
#256
Tragic
87.5%
Bahamians
0.7
/100
|
#257
Tragic
87.5%
Immigrants | Ghana
0.5
/100
|
#258
Tragic
87.4%
Immigrants | Western Africa
0.5
/100
|
#259
Tragic
87.4%
Cajuns
0.4
/100
|
#260
Tragic
87.3%

Demographics Similar to Scotch-Irish by High School Diploma

In terms of high school diploma, the demographic groups most similar to Scotch-Irish are Immigrants from Moldova (90.7%, a difference of 0.020%), Immigrants from England (90.8%, a difference of 0.040%), Immigrants from Switzerland (90.8%, a difference of 0.040%), Immigrants from Denmark (90.8%, a difference of 0.050%), and Immigrants from Saudi Arabia (90.7%, a difference of 0.050%).
DemographicsRating | RankHigh School Diploma
Cambodians
99.4
/100
|
#75
Exceptional
90.8%
Hungarians
99.3
/100
|
#76
Exceptional
90.8%
Native Hawaiians
99.3
/100
|
#77
Exceptional
90.8%
Burmese
99.3
/100
|
#78
Exceptional
90.8%
Immigrants | Denmark
99.3
/100
|
#79
Exceptional
90.8%
Immigrants | England
99.3
/100
|
#80
Exceptional
90.8%
Immigrants | Switzerland
99.3
/100
|
#81
Exceptional
90.8%
Scotch-Irish
99.2
/100
|
#82
Exceptional
90.8%
Immigrants | Moldova
99.2
/100
|
#83
Exceptional
90.7%
Immigrants | Saudi Arabia
99.1
/100
|
#84
Exceptional
90.7%
Romanians
98.9
/100
|
#85
Exceptional
90.7%
Immigrants | Bulgaria
98.9
/100
|
#86
Exceptional
90.6%
Immigrants | Turkey
98.9
/100
|
#87
Exceptional
90.6%
Immigrants | France
98.8
/100
|
#88
Exceptional
90.6%
Canadians
98.7
/100
|
#89
Exceptional
90.6%