Bangladeshi vs Jordanian High School Diploma
COMPARE
Bangladeshi
Jordanian
High School Diploma
High School Diploma Comparison
Bangladeshis
Jordanians
86.9%
HIGH SCHOOL DIPLOMA
0.1/ 100
METRIC RATING
274th/ 347
METRIC RANK
90.2%
HIGH SCHOOL DIPLOMA
95.4/ 100
METRIC RATING
117th/ 347
METRIC RANK
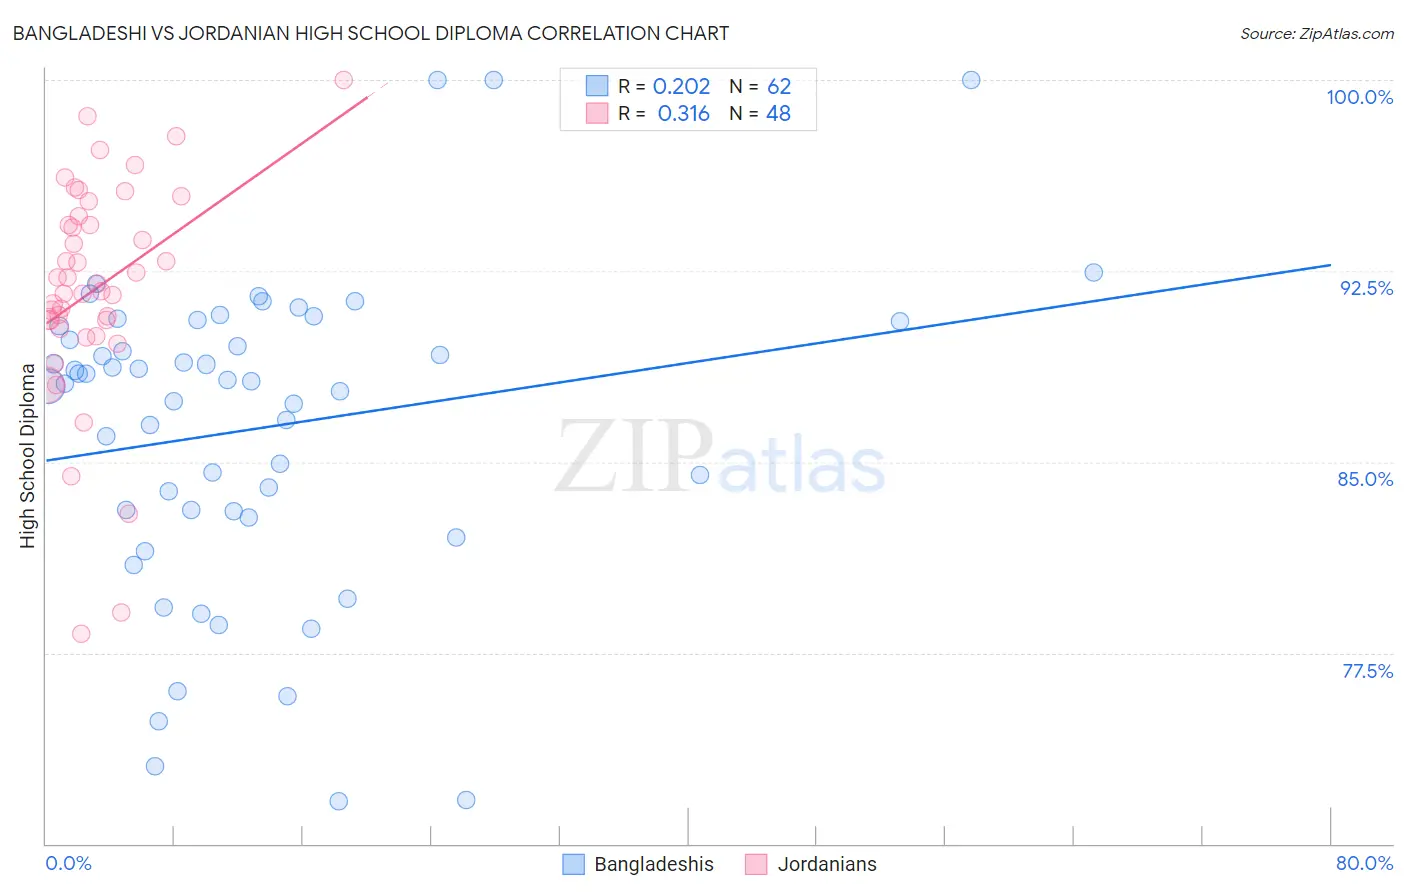
Bangladeshi vs Jordanian High School Diploma Correlation Chart
The statistical analysis conducted on geographies consisting of 141,450,108 people shows a weak positive correlation between the proportion of Bangladeshis and percentage of population with at least high school diploma education in the United States with a correlation coefficient (R) of 0.202 and weighted average of 86.9%. Similarly, the statistical analysis conducted on geographies consisting of 166,423,935 people shows a mild positive correlation between the proportion of Jordanians and percentage of population with at least high school diploma education in the United States with a correlation coefficient (R) of 0.316 and weighted average of 90.2%, a difference of 3.8%.
High School Diploma Correlation Summary
| Measurement | Bangladeshi | Jordanian |
| Minimum | 71.7% | 78.2% |
| Maximum | 100.0% | 100.0% |
| Range | 28.3% | 21.8% |
| Mean | 86.3% | 91.8% |
| Median | 88.1% | 91.9% |
| Interquartile 25% (IQ1) | 83.1% | 90.4% |
| Interquartile 75% (IQ3) | 90.3% | 94.5% |
| Interquartile Range (IQR) | 7.3% | 4.1% |
| Standard Deviation (Sample) | 6.2% | 4.4% |
| Standard Deviation (Population) | 6.1% | 4.3% |
Similar Demographics by High School Diploma
Demographics Similar to Bangladeshis by High School Diploma
In terms of high school diploma, the demographic groups most similar to Bangladeshis are Immigrants from Jamaica (86.9%, a difference of 0.010%), Trinidadian and Tobagonian (86.9%, a difference of 0.040%), West Indian (86.9%, a difference of 0.050%), Malaysian (87.0%, a difference of 0.12%), and Sri Lankan (87.0%, a difference of 0.13%).
| Demographics | Rating | Rank | High School Diploma |
| Blacks/African Americans | 0.2 /100 | #267 | Tragic 87.0% |
| Pennsylvania Germans | 0.2 /100 | #268 | Tragic 87.0% |
| Sri Lankans | 0.2 /100 | #269 | Tragic 87.0% |
| Malaysians | 0.2 /100 | #270 | Tragic 87.0% |
| West Indians | 0.1 /100 | #271 | Tragic 86.9% |
| Trinidadians and Tobagonians | 0.1 /100 | #272 | Tragic 86.9% |
| Immigrants | Jamaica | 0.1 /100 | #273 | Tragic 86.9% |
| Bangladeshis | 0.1 /100 | #274 | Tragic 86.9% |
| Immigrants | Trinidad and Tobago | 0.1 /100 | #275 | Tragic 86.8% |
| Immigrants | Burma/Myanmar | 0.1 /100 | #276 | Tragic 86.7% |
| Barbadians | 0.1 /100 | #277 | Tragic 86.7% |
| Hopi | 0.1 /100 | #278 | Tragic 86.6% |
| Immigrants | Laos | 0.0 /100 | #279 | Tragic 86.6% |
| Pueblo | 0.0 /100 | #280 | Tragic 86.5% |
| Indonesians | 0.0 /100 | #281 | Tragic 86.5% |
Demographics Similar to Jordanians by High School Diploma
In terms of high school diploma, the demographic groups most similar to Jordanians are Israeli (90.1%, a difference of 0.020%), Immigrants from Germany (90.2%, a difference of 0.030%), Immigrants from Hungary (90.2%, a difference of 0.040%), Immigrants from Eastern Europe (90.1%, a difference of 0.040%), and Ottawa (90.1%, a difference of 0.070%).
| Demographics | Rating | Rank | High School Diploma |
| Immigrants | Greece | 96.6 /100 | #110 | Exceptional 90.3% |
| Menominee | 96.6 /100 | #111 | Exceptional 90.3% |
| Immigrants | Belarus | 96.4 /100 | #112 | Exceptional 90.2% |
| Immigrants | Sri Lanka | 96.3 /100 | #113 | Exceptional 90.2% |
| Yugoslavians | 96.2 /100 | #114 | Exceptional 90.2% |
| Immigrants | Hungary | 95.8 /100 | #115 | Exceptional 90.2% |
| Immigrants | Germany | 95.7 /100 | #116 | Exceptional 90.2% |
| Jordanians | 95.4 /100 | #117 | Exceptional 90.2% |
| Israelis | 95.1 /100 | #118 | Exceptional 90.1% |
| Immigrants | Eastern Europe | 94.9 /100 | #119 | Exceptional 90.1% |
| Ottawa | 94.4 /100 | #120 | Exceptional 90.1% |
| Whites/Caucasians | 94.1 /100 | #121 | Exceptional 90.1% |
| Immigrants | Kazakhstan | 93.4 /100 | #122 | Exceptional 90.0% |
| German Russians | 92.0 /100 | #123 | Exceptional 90.0% |
| Mongolians | 91.6 /100 | #124 | Exceptional 89.9% |