Argentinean vs Immigrants from Southern Europe 11th Grade
COMPARE
Argentinean
Immigrants from Southern Europe
11th Grade
11th Grade Comparison
Argentineans
Immigrants from Southern Europe
92.7%
11TH GRADE
73.4/ 100
METRIC RATING
155th/ 347
METRIC RANK
92.1%
11TH GRADE
12.5/ 100
METRIC RATING
215th/ 347
METRIC RANK
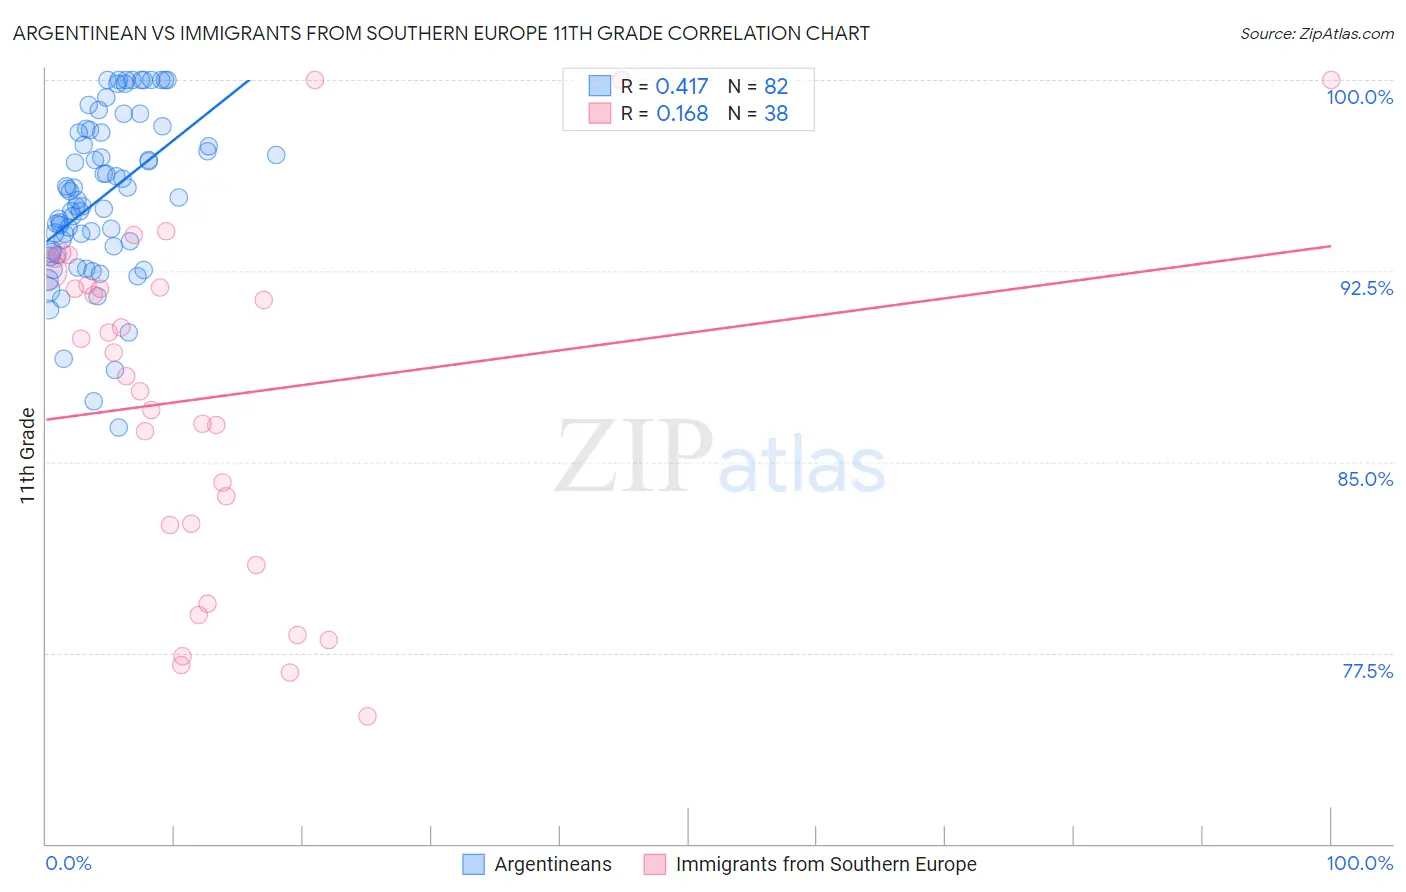
Argentinean vs Immigrants from Southern Europe 11th Grade Correlation Chart
The statistical analysis conducted on geographies consisting of 297,143,432 people shows a moderate positive correlation between the proportion of Argentineans and percentage of population with at least 11th grade education in the United States with a correlation coefficient (R) of 0.417 and weighted average of 92.7%. Similarly, the statistical analysis conducted on geographies consisting of 402,804,595 people shows a poor positive correlation between the proportion of Immigrants from Southern Europe and percentage of population with at least 11th grade education in the United States with a correlation coefficient (R) of 0.168 and weighted average of 92.1%, a difference of 0.73%.
11th Grade Correlation Summary
| Measurement | Argentinean | Immigrants from Southern Europe |
| Minimum | 86.3% | 75.0% |
| Maximum | 100.0% | 100.0% |
| Range | 13.7% | 25.0% |
| Mean | 95.4% | 87.5% |
| Median | 95.3% | 88.8% |
| Interquartile 25% (IQ1) | 93.3% | 82.5% |
| Interquartile 75% (IQ3) | 97.9% | 92.0% |
| Interquartile Range (IQR) | 4.6% | 9.4% |
| Standard Deviation (Sample) | 3.2% | 6.8% |
| Standard Deviation (Population) | 3.2% | 6.7% |
Similar Demographics by 11th Grade
Demographics Similar to Argentineans by 11th Grade
In terms of 11th grade, the demographic groups most similar to Argentineans are Osage (92.7%, a difference of 0.0%), Immigrants from Spain (92.7%, a difference of 0.0%), Potawatomi (92.8%, a difference of 0.010%), Iraqi (92.8%, a difference of 0.010%), and Brazilian (92.8%, a difference of 0.010%).
| Demographics | Rating | Rank | 11th Grade |
| Hmong | 78.6 /100 | #148 | Good 92.8% |
| Immigrants | Poland | 78.5 /100 | #149 | Good 92.8% |
| Immigrants | Egypt | 77.5 /100 | #150 | Good 92.8% |
| Potawatomi | 74.3 /100 | #151 | Good 92.8% |
| Iraqis | 74.2 /100 | #152 | Good 92.8% |
| Brazilians | 73.9 /100 | #153 | Good 92.8% |
| Osage | 73.4 /100 | #154 | Good 92.7% |
| Argentineans | 73.4 /100 | #155 | Good 92.7% |
| Immigrants | Spain | 73.0 /100 | #156 | Good 92.7% |
| Immigrants | Eastern Asia | 72.6 /100 | #157 | Good 92.7% |
| Immigrants | Venezuela | 72.0 /100 | #158 | Good 92.7% |
| Americans | 71.7 /100 | #159 | Good 92.7% |
| Immigrants | Lebanon | 70.7 /100 | #160 | Good 92.7% |
| Immigrants | Argentina | 69.8 /100 | #161 | Good 92.7% |
| Paraguayans | 68.7 /100 | #162 | Good 92.7% |
Demographics Similar to Immigrants from Southern Europe by 11th Grade
In terms of 11th grade, the demographic groups most similar to Immigrants from Southern Europe are Afghan (92.1%, a difference of 0.010%), Somali (92.1%, a difference of 0.020%), Immigrants from Ethiopia (92.1%, a difference of 0.030%), Immigrants from Sierra Leone (92.0%, a difference of 0.030%), and Korean (92.1%, a difference of 0.040%).
| Demographics | Rating | Rank | 11th Grade |
| Colville | 21.8 /100 | #208 | Fair 92.2% |
| Tongans | 19.8 /100 | #209 | Poor 92.2% |
| Ethiopians | 18.8 /100 | #210 | Poor 92.2% |
| Immigrants | Micronesia | 17.7 /100 | #211 | Poor 92.2% |
| Koreans | 14.4 /100 | #212 | Poor 92.1% |
| Immigrants | Ethiopia | 13.9 /100 | #213 | Poor 92.1% |
| Afghans | 12.8 /100 | #214 | Poor 92.1% |
| Immigrants | Southern Europe | 12.5 /100 | #215 | Poor 92.1% |
| Somalis | 11.6 /100 | #216 | Poor 92.1% |
| Immigrants | Sierra Leone | 11.1 /100 | #217 | Poor 92.0% |
| Blackfeet | 10.1 /100 | #218 | Poor 92.0% |
| Portuguese | 10.0 /100 | #219 | Tragic 92.0% |
| South American Indians | 7.6 /100 | #220 | Tragic 92.0% |
| Immigrants | Liberia | 7.0 /100 | #221 | Tragic 91.9% |
| Immigrants | Africa | 6.5 /100 | #222 | Tragic 91.9% |