Malaysian vs Immigrants from Southern Europe 11th Grade
COMPARE
Malaysian
Immigrants from Southern Europe
11th Grade
11th Grade Comparison
Malaysians
Immigrants from Southern Europe
90.8%
11TH GRADE
0.1/ 100
METRIC RATING
278th/ 347
METRIC RANK
92.1%
11TH GRADE
12.5/ 100
METRIC RATING
215th/ 347
METRIC RANK
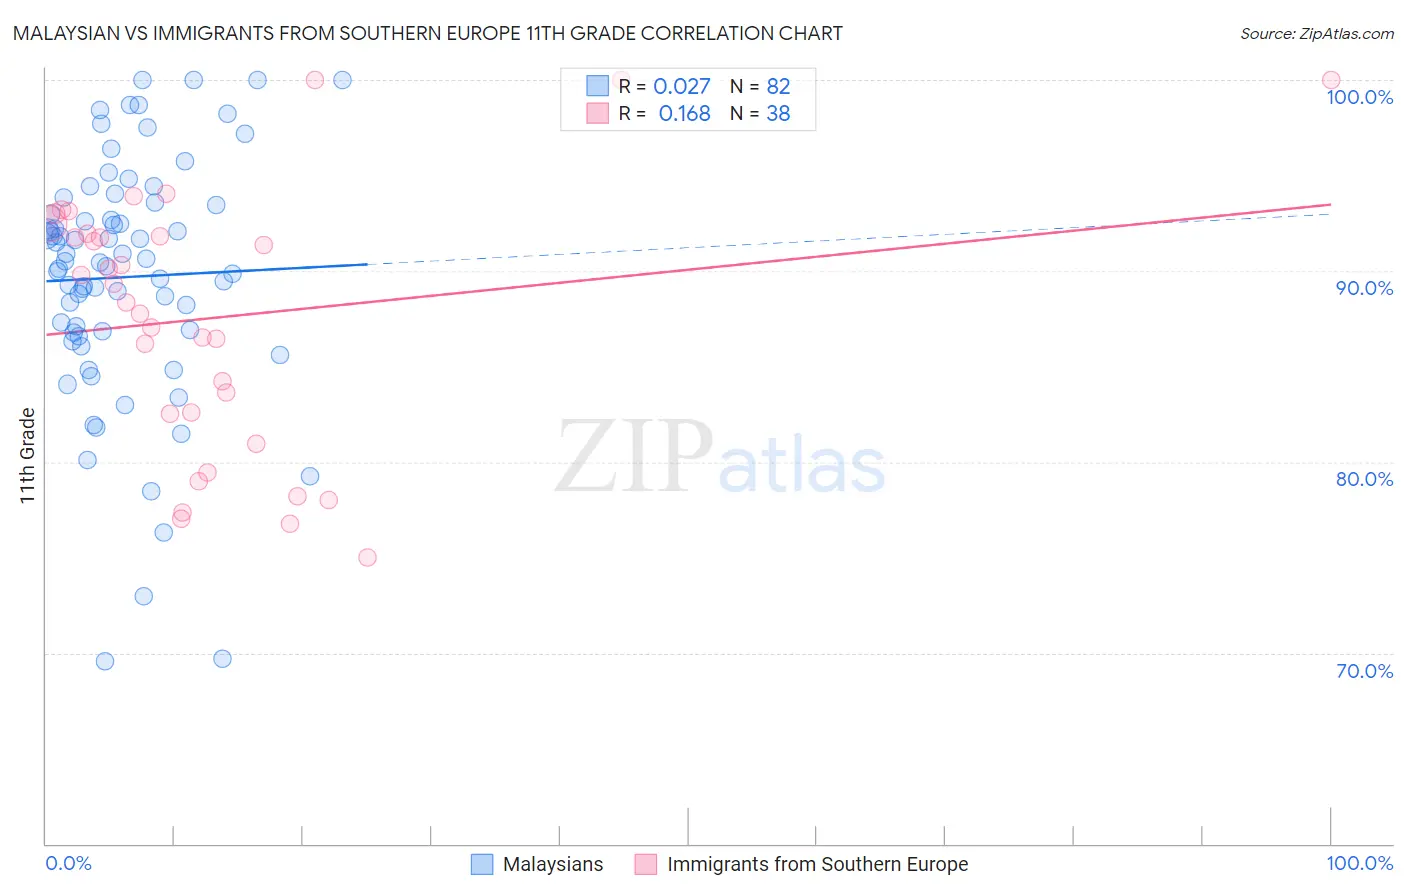
Malaysian vs Immigrants from Southern Europe 11th Grade Correlation Chart
The statistical analysis conducted on geographies consisting of 226,109,984 people shows no correlation between the proportion of Malaysians and percentage of population with at least 11th grade education in the United States with a correlation coefficient (R) of 0.027 and weighted average of 90.8%. Similarly, the statistical analysis conducted on geographies consisting of 402,804,595 people shows a poor positive correlation between the proportion of Immigrants from Southern Europe and percentage of population with at least 11th grade education in the United States with a correlation coefficient (R) of 0.168 and weighted average of 92.1%, a difference of 1.4%.
11th Grade Correlation Summary
| Measurement | Malaysian | Immigrants from Southern Europe |
| Minimum | 69.5% | 75.0% |
| Maximum | 100.0% | 100.0% |
| Range | 30.5% | 25.0% |
| Mean | 89.7% | 87.5% |
| Median | 90.5% | 88.8% |
| Interquartile 25% (IQ1) | 86.8% | 82.5% |
| Interquartile 75% (IQ3) | 93.5% | 92.0% |
| Interquartile Range (IQR) | 6.7% | 9.4% |
| Standard Deviation (Sample) | 6.4% | 6.8% |
| Standard Deviation (Population) | 6.4% | 6.7% |
Similar Demographics by 11th Grade
Demographics Similar to Malaysians by 11th Grade
In terms of 11th grade, the demographic groups most similar to Malaysians are Immigrants from Congo (90.9%, a difference of 0.040%), Barbadian (90.8%, a difference of 0.040%), Bangladeshi (90.9%, a difference of 0.050%), Sri Lankan (90.7%, a difference of 0.11%), and Immigrants from South Eastern Asia (90.9%, a difference of 0.13%).
| Demographics | Rating | Rank | 11th Grade |
| Immigrants | Peru | 0.1 /100 | #271 | Tragic 91.0% |
| West Indians | 0.1 /100 | #272 | Tragic 91.0% |
| Paiute | 0.1 /100 | #273 | Tragic 91.0% |
| Immigrants | Trinidad and Tobago | 0.1 /100 | #274 | Tragic 90.9% |
| Immigrants | South Eastern Asia | 0.1 /100 | #275 | Tragic 90.9% |
| Bangladeshis | 0.1 /100 | #276 | Tragic 90.9% |
| Immigrants | Congo | 0.1 /100 | #277 | Tragic 90.9% |
| Malaysians | 0.1 /100 | #278 | Tragic 90.8% |
| Barbadians | 0.0 /100 | #279 | Tragic 90.8% |
| Sri Lankans | 0.0 /100 | #280 | Tragic 90.7% |
| Dutch West Indians | 0.0 /100 | #281 | Tragic 90.7% |
| Immigrants | St. Vincent and the Grenadines | 0.0 /100 | #282 | Tragic 90.7% |
| Immigrants | Barbados | 0.0 /100 | #283 | Tragic 90.7% |
| Immigrants | Laos | 0.0 /100 | #284 | Tragic 90.5% |
| Immigrants | Burma/Myanmar | 0.0 /100 | #285 | Tragic 90.4% |
Demographics Similar to Immigrants from Southern Europe by 11th Grade
In terms of 11th grade, the demographic groups most similar to Immigrants from Southern Europe are Afghan (92.1%, a difference of 0.010%), Somali (92.1%, a difference of 0.020%), Immigrants from Ethiopia (92.1%, a difference of 0.030%), Immigrants from Sierra Leone (92.0%, a difference of 0.030%), and Korean (92.1%, a difference of 0.040%).
| Demographics | Rating | Rank | 11th Grade |
| Colville | 21.8 /100 | #208 | Fair 92.2% |
| Tongans | 19.8 /100 | #209 | Poor 92.2% |
| Ethiopians | 18.8 /100 | #210 | Poor 92.2% |
| Immigrants | Micronesia | 17.7 /100 | #211 | Poor 92.2% |
| Koreans | 14.4 /100 | #212 | Poor 92.1% |
| Immigrants | Ethiopia | 13.9 /100 | #213 | Poor 92.1% |
| Afghans | 12.8 /100 | #214 | Poor 92.1% |
| Immigrants | Southern Europe | 12.5 /100 | #215 | Poor 92.1% |
| Somalis | 11.6 /100 | #216 | Poor 92.1% |
| Immigrants | Sierra Leone | 11.1 /100 | #217 | Poor 92.0% |
| Blackfeet | 10.1 /100 | #218 | Poor 92.0% |
| Portuguese | 10.0 /100 | #219 | Tragic 92.0% |
| South American Indians | 7.6 /100 | #220 | Tragic 92.0% |
| Immigrants | Liberia | 7.0 /100 | #221 | Tragic 91.9% |
| Immigrants | Africa | 6.5 /100 | #222 | Tragic 91.9% |