Argentinean vs Immigrants from Southern Europe Associate's Degree
COMPARE
Argentinean
Immigrants from Southern Europe
Associate's Degree
Associate's Degree Comparison
Argentineans
Immigrants from Southern Europe
51.2%
ASSOCIATE'S DEGREE
99.6/ 100
METRIC RATING
67th/ 347
METRIC RANK
47.8%
ASSOCIATE'S DEGREE
84.4/ 100
METRIC RATING
140th/ 347
METRIC RANK
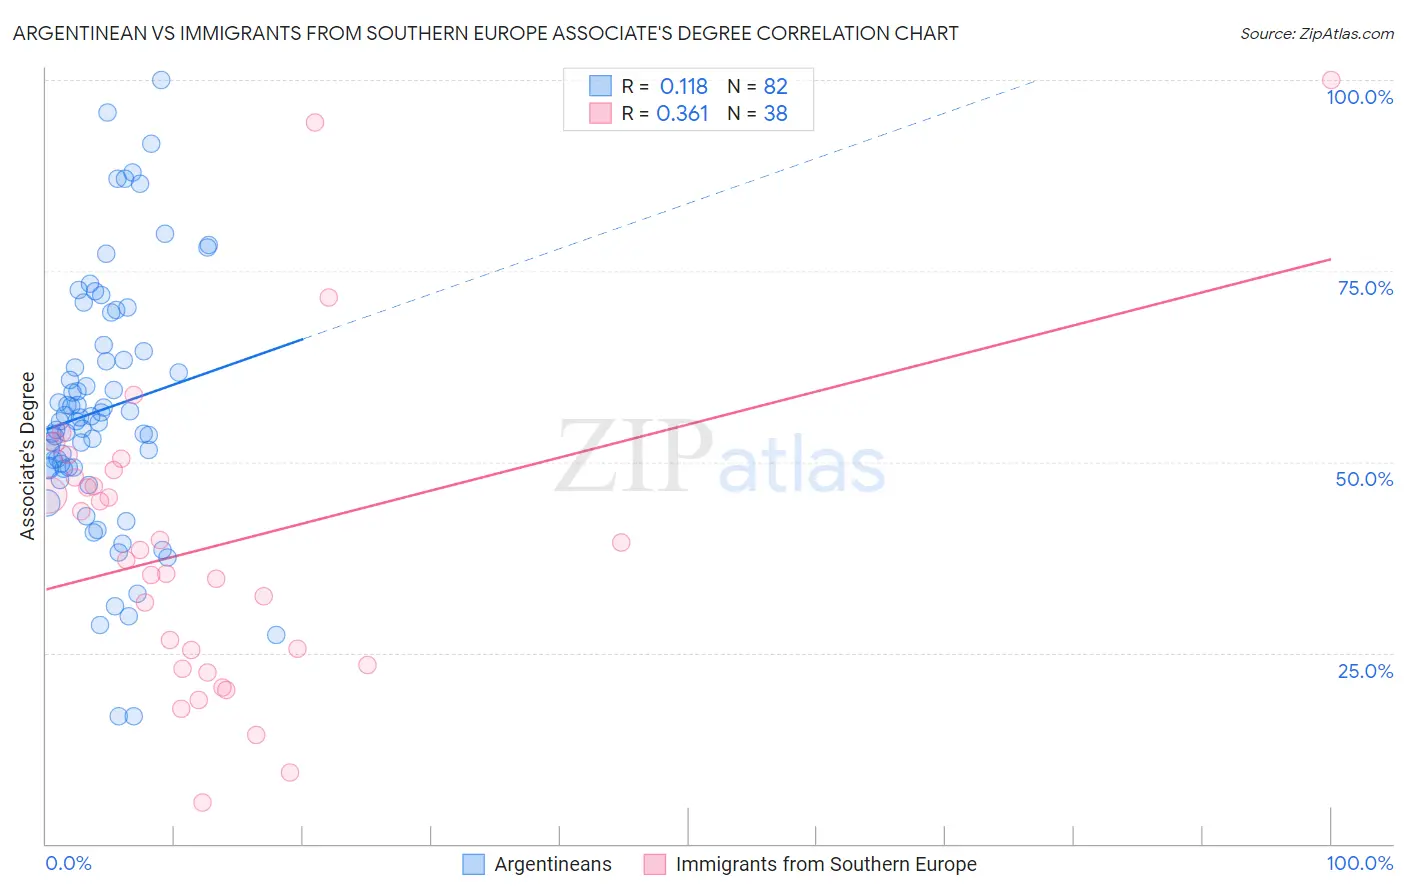
Argentinean vs Immigrants from Southern Europe Associate's Degree Correlation Chart
The statistical analysis conducted on geographies consisting of 297,131,671 people shows a poor positive correlation between the proportion of Argentineans and percentage of population with at least associate's degree education in the United States with a correlation coefficient (R) of 0.118 and weighted average of 51.2%. Similarly, the statistical analysis conducted on geographies consisting of 402,795,863 people shows a mild positive correlation between the proportion of Immigrants from Southern Europe and percentage of population with at least associate's degree education in the United States with a correlation coefficient (R) of 0.361 and weighted average of 47.8%, a difference of 7.2%.
Associate's Degree Correlation Summary
| Measurement | Argentinean | Immigrants from Southern Europe |
| Minimum | 16.7% | 5.4% |
| Maximum | 100.0% | 100.0% |
| Range | 83.3% | 94.6% |
| Mean | 56.8% | 38.9% |
| Median | 55.3% | 37.8% |
| Interquartile 25% (IQ1) | 49.2% | 23.3% |
| Interquartile 75% (IQ3) | 64.5% | 48.0% |
| Interquartile Range (IQR) | 15.4% | 24.7% |
| Standard Deviation (Sample) | 16.6% | 20.1% |
| Standard Deviation (Population) | 16.5% | 19.9% |
Similar Demographics by Associate's Degree
Demographics Similar to Argentineans by Associate's Degree
In terms of associate's degree, the demographic groups most similar to Argentineans are Immigrants from Europe (51.3%, a difference of 0.13%), Zimbabwean (51.3%, a difference of 0.18%), Immigrants from Netherlands (51.4%, a difference of 0.22%), South African (51.4%, a difference of 0.29%), and Bhutanese (51.4%, a difference of 0.34%).
| Demographics | Rating | Rank | Associate's Degree |
| Immigrants | Bolivia | 99.7 /100 | #60 | Exceptional 51.5% |
| Immigrants | Kazakhstan | 99.7 /100 | #61 | Exceptional 51.4% |
| Bhutanese | 99.7 /100 | #62 | Exceptional 51.4% |
| South Africans | 99.7 /100 | #63 | Exceptional 51.4% |
| Immigrants | Netherlands | 99.7 /100 | #64 | Exceptional 51.4% |
| Zimbabweans | 99.7 /100 | #65 | Exceptional 51.3% |
| Immigrants | Europe | 99.7 /100 | #66 | Exceptional 51.3% |
| Argentineans | 99.6 /100 | #67 | Exceptional 51.2% |
| Immigrants | Indonesia | 99.5 /100 | #68 | Exceptional 51.0% |
| Egyptians | 99.5 /100 | #69 | Exceptional 50.9% |
| Immigrants | Argentina | 99.5 /100 | #70 | Exceptional 50.9% |
| Immigrants | Romania | 99.5 /100 | #71 | Exceptional 50.9% |
| Immigrants | Pakistan | 99.5 /100 | #72 | Exceptional 50.9% |
| Carpatho Rusyns | 99.3 /100 | #73 | Exceptional 50.6% |
| Lithuanians | 99.3 /100 | #74 | Exceptional 50.6% |
Demographics Similar to Immigrants from Southern Europe by Associate's Degree
In terms of associate's degree, the demographic groups most similar to Immigrants from Southern Europe are Slovene (47.9%, a difference of 0.090%), Taiwanese (47.7%, a difference of 0.15%), Sierra Leonean (47.7%, a difference of 0.20%), Norwegian (47.6%, a difference of 0.43%), and Polish (48.0%, a difference of 0.44%).
| Demographics | Rating | Rank | Associate's Degree |
| Assyrians/Chaldeans/Syriacs | 89.4 /100 | #133 | Excellent 48.2% |
| Moroccans | 89.3 /100 | #134 | Excellent 48.2% |
| Europeans | 89.0 /100 | #135 | Excellent 48.2% |
| Pakistanis | 88.0 /100 | #136 | Excellent 48.1% |
| Immigrants | Eritrea | 87.8 /100 | #137 | Excellent 48.1% |
| Poles | 87.3 /100 | #138 | Excellent 48.0% |
| Slovenes | 85.1 /100 | #139 | Excellent 47.9% |
| Immigrants | Southern Europe | 84.4 /100 | #140 | Excellent 47.8% |
| Taiwanese | 83.3 /100 | #141 | Excellent 47.7% |
| Sierra Leoneans | 82.9 /100 | #142 | Excellent 47.7% |
| Norwegians | 81.0 /100 | #143 | Excellent 47.6% |
| Slavs | 80.5 /100 | #144 | Excellent 47.6% |
| Canadians | 79.0 /100 | #145 | Good 47.5% |
| Immigrants | Sudan | 77.9 /100 | #146 | Good 47.4% |
| Danes | 77.3 /100 | #147 | Good 47.4% |