Argentinean vs Immigrants from Haiti 11th Grade
COMPARE
Argentinean
Immigrants from Haiti
11th Grade
11th Grade Comparison
Argentineans
Immigrants from Haiti
92.7%
11TH GRADE
73.4/ 100
METRIC RATING
155th/ 347
METRIC RANK
89.9%
11TH GRADE
0.0/ 100
METRIC RATING
300th/ 347
METRIC RANK
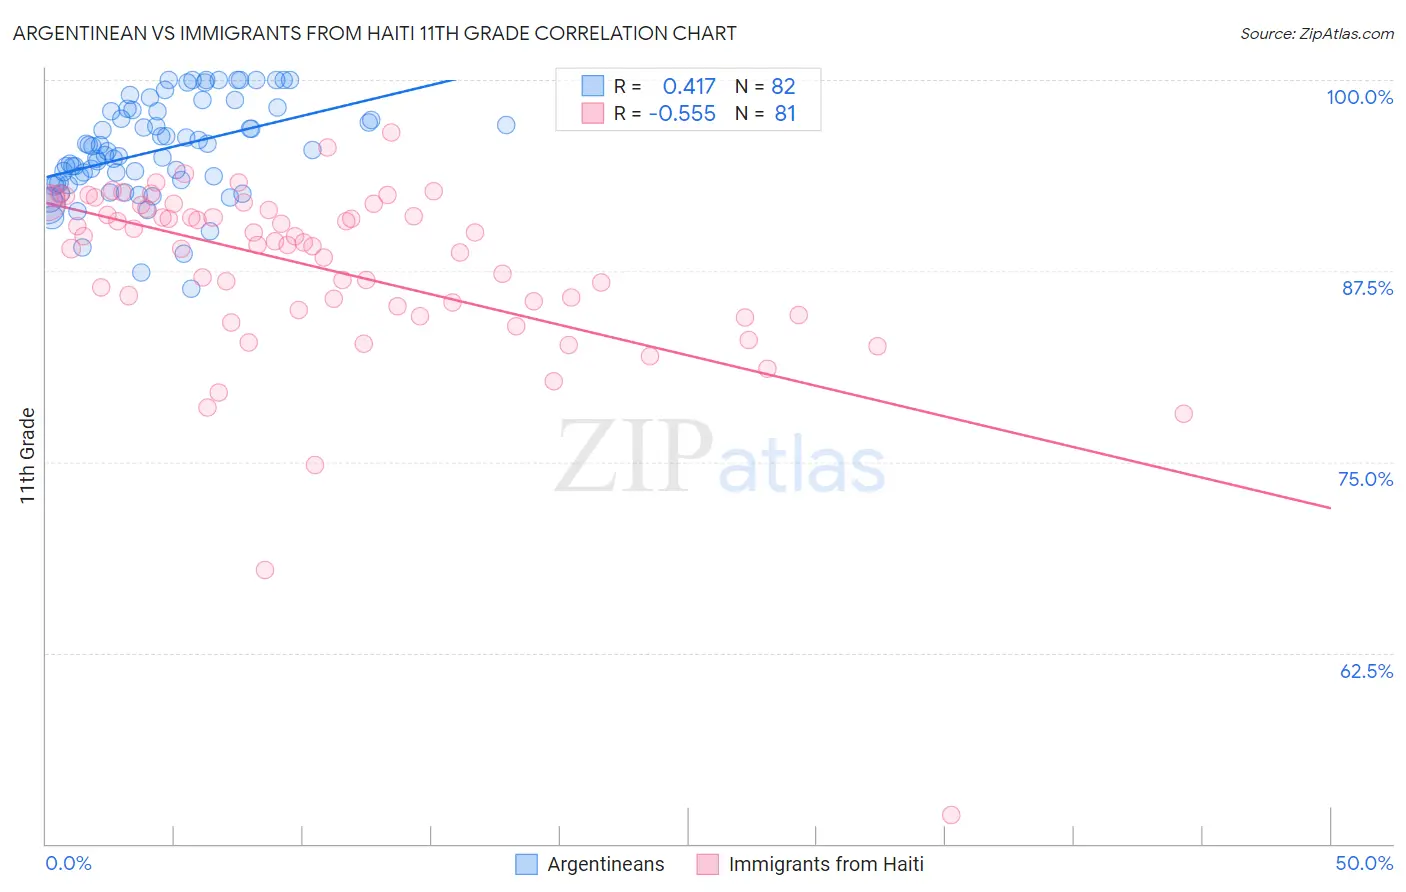
Argentinean vs Immigrants from Haiti 11th Grade Correlation Chart
The statistical analysis conducted on geographies consisting of 297,143,432 people shows a moderate positive correlation between the proportion of Argentineans and percentage of population with at least 11th grade education in the United States with a correlation coefficient (R) of 0.417 and weighted average of 92.7%. Similarly, the statistical analysis conducted on geographies consisting of 225,286,322 people shows a substantial negative correlation between the proportion of Immigrants from Haiti and percentage of population with at least 11th grade education in the United States with a correlation coefficient (R) of -0.555 and weighted average of 89.9%, a difference of 3.2%.
11th Grade Correlation Summary
| Measurement | Argentinean | Immigrants from Haiti |
| Minimum | 86.3% | 51.9% |
| Maximum | 100.0% | 96.6% |
| Range | 13.7% | 44.7% |
| Mean | 95.4% | 87.6% |
| Median | 95.3% | 89.3% |
| Interquartile 25% (IQ1) | 93.3% | 85.1% |
| Interquartile 75% (IQ3) | 97.9% | 91.7% |
| Interquartile Range (IQR) | 4.6% | 6.6% |
| Standard Deviation (Sample) | 3.2% | 6.3% |
| Standard Deviation (Population) | 3.2% | 6.3% |
Similar Demographics by 11th Grade
Demographics Similar to Argentineans by 11th Grade
In terms of 11th grade, the demographic groups most similar to Argentineans are Osage (92.7%, a difference of 0.0%), Immigrants from Spain (92.7%, a difference of 0.0%), Potawatomi (92.8%, a difference of 0.010%), Iraqi (92.8%, a difference of 0.010%), and Brazilian (92.8%, a difference of 0.010%).
| Demographics | Rating | Rank | 11th Grade |
| Hmong | 78.6 /100 | #148 | Good 92.8% |
| Immigrants | Poland | 78.5 /100 | #149 | Good 92.8% |
| Immigrants | Egypt | 77.5 /100 | #150 | Good 92.8% |
| Potawatomi | 74.3 /100 | #151 | Good 92.8% |
| Iraqis | 74.2 /100 | #152 | Good 92.8% |
| Brazilians | 73.9 /100 | #153 | Good 92.8% |
| Osage | 73.4 /100 | #154 | Good 92.7% |
| Argentineans | 73.4 /100 | #155 | Good 92.7% |
| Immigrants | Spain | 73.0 /100 | #156 | Good 92.7% |
| Immigrants | Eastern Asia | 72.6 /100 | #157 | Good 92.7% |
| Immigrants | Venezuela | 72.0 /100 | #158 | Good 92.7% |
| Americans | 71.7 /100 | #159 | Good 92.7% |
| Immigrants | Lebanon | 70.7 /100 | #160 | Good 92.7% |
| Immigrants | Argentina | 69.8 /100 | #161 | Good 92.7% |
| Paraguayans | 68.7 /100 | #162 | Good 92.7% |
Demographics Similar to Immigrants from Haiti by 11th Grade
In terms of 11th grade, the demographic groups most similar to Immigrants from Haiti are Japanese (89.9%, a difference of 0.010%), Guyanese (89.9%, a difference of 0.010%), Immigrants from Fiji (89.9%, a difference of 0.040%), Navajo (90.0%, a difference of 0.11%), and Fijian (90.0%, a difference of 0.15%).
| Demographics | Rating | Rank | 11th Grade |
| Natives/Alaskans | 0.0 /100 | #293 | Tragic 90.2% |
| Immigrants | Grenada | 0.0 /100 | #294 | Tragic 90.1% |
| Immigrants | Vietnam | 0.0 /100 | #295 | Tragic 90.0% |
| Fijians | 0.0 /100 | #296 | Tragic 90.0% |
| Navajo | 0.0 /100 | #297 | Tragic 90.0% |
| Immigrants | Fiji | 0.0 /100 | #298 | Tragic 89.9% |
| Japanese | 0.0 /100 | #299 | Tragic 89.9% |
| Immigrants | Haiti | 0.0 /100 | #300 | Tragic 89.9% |
| Guyanese | 0.0 /100 | #301 | Tragic 89.9% |
| Immigrants | Guyana | 0.0 /100 | #302 | Tragic 89.7% |
| Immigrants | Immigrants | 0.0 /100 | #303 | Tragic 89.7% |
| Yuman | 0.0 /100 | #304 | Tragic 89.7% |
| Immigrants | Cambodia | 0.0 /100 | #305 | Tragic 89.6% |
| Ecuadorians | 0.0 /100 | #306 | Tragic 89.6% |
| Immigrants | Dominica | 0.0 /100 | #307 | Tragic 89.5% |