Aleut vs Lithuanian GED/Equivalency
COMPARE
Aleut
Lithuanian
GED/Equivalency
GED/Equivalency Comparison
Aleuts
Lithuanians
85.6%
GED/EQUIVALENCY
40.5/ 100
METRIC RATING
179th/ 347
METRIC RANK
88.9%
GED/EQUIVALENCY
99.9/ 100
METRIC RATING
12th/ 347
METRIC RANK
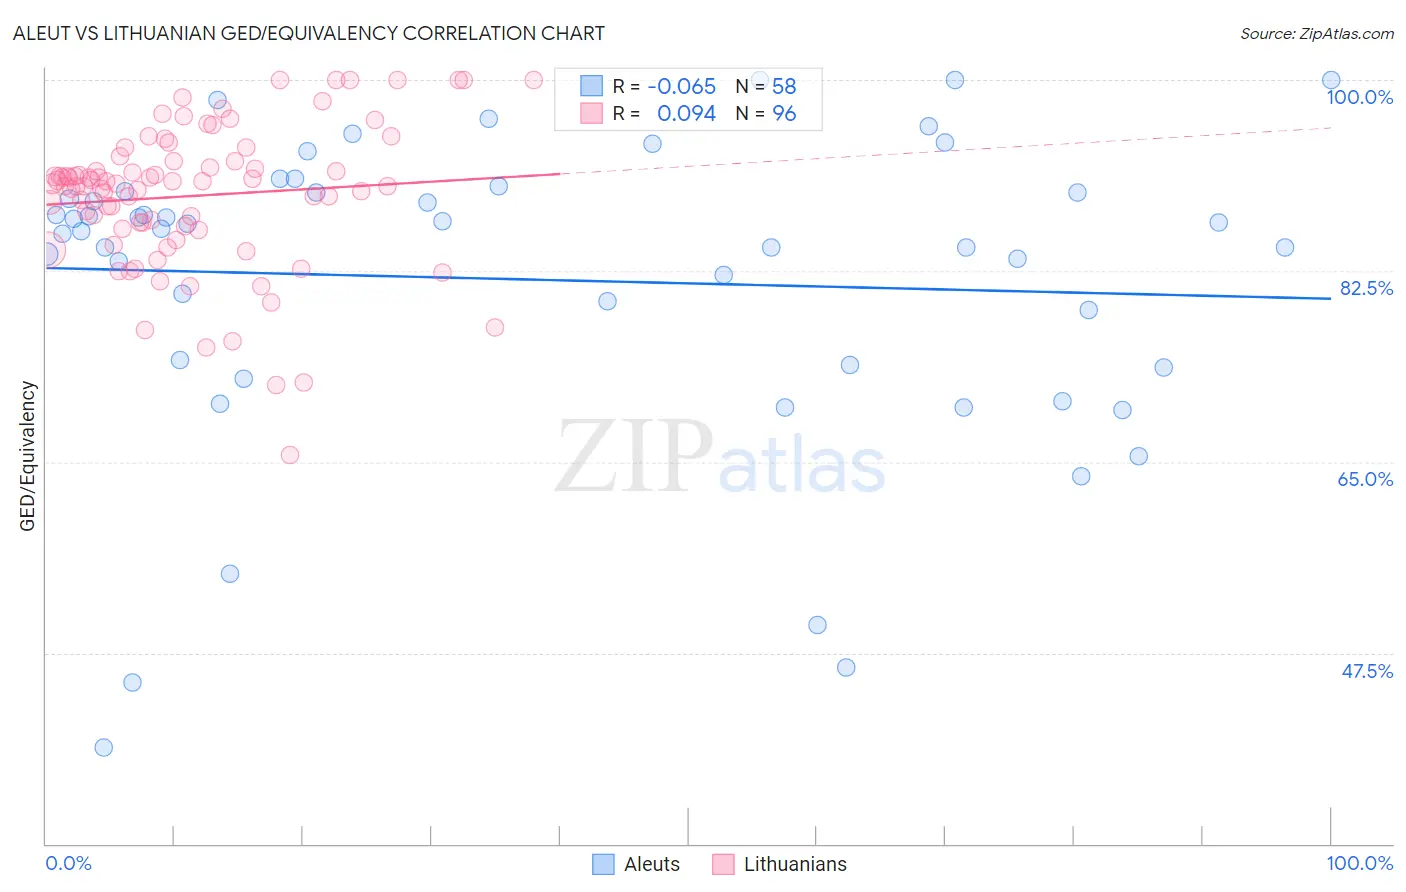
Aleut vs Lithuanian GED/Equivalency Correlation Chart
The statistical analysis conducted on geographies consisting of 61,782,940 people shows a slight negative correlation between the proportion of Aleuts and percentage of population with at least ged/equivalency education in the United States with a correlation coefficient (R) of -0.065 and weighted average of 85.6%. Similarly, the statistical analysis conducted on geographies consisting of 421,947,832 people shows a slight positive correlation between the proportion of Lithuanians and percentage of population with at least ged/equivalency education in the United States with a correlation coefficient (R) of 0.094 and weighted average of 88.9%, a difference of 3.9%.
GED/Equivalency Correlation Summary
| Measurement | Aleut | Lithuanian |
| Minimum | 38.8% | 65.6% |
| Maximum | 100.0% | 100.0% |
| Range | 61.2% | 34.4% |
| Mean | 81.7% | 89.4% |
| Median | 86.3% | 90.5% |
| Interquartile 25% (IQ1) | 73.9% | 86.5% |
| Interquartile 75% (IQ3) | 89.7% | 92.6% |
| Interquartile Range (IQR) | 15.8% | 6.1% |
| Standard Deviation (Sample) | 13.9% | 6.6% |
| Standard Deviation (Population) | 13.8% | 6.5% |
Similar Demographics by GED/Equivalency
Demographics Similar to Aleuts by GED/Equivalency
In terms of ged/equivalency, the demographic groups most similar to Aleuts are Korean (85.6%, a difference of 0.020%), Immigrants from Southern Europe (85.5%, a difference of 0.040%), Moroccan (85.5%, a difference of 0.060%), Immigrants from Uganda (85.7%, a difference of 0.10%), and Sudanese (85.5%, a difference of 0.12%).
| Demographics | Rating | Rank | GED/Equivalency |
| Bermudans | 55.1 /100 | #172 | Average 85.8% |
| Immigrants | Venezuela | 50.7 /100 | #173 | Average 85.8% |
| Ottawa | 50.0 /100 | #174 | Average 85.8% |
| Immigrants | Bolivia | 49.8 /100 | #175 | Average 85.8% |
| Immigrants | Eastern Africa | 47.7 /100 | #176 | Average 85.7% |
| Immigrants | Uganda | 45.2 /100 | #177 | Average 85.7% |
| Koreans | 41.2 /100 | #178 | Average 85.6% |
| Aleuts | 40.5 /100 | #179 | Average 85.6% |
| Immigrants | Southern Europe | 38.4 /100 | #180 | Fair 85.5% |
| Moroccans | 37.7 /100 | #181 | Fair 85.5% |
| Sudanese | 35.2 /100 | #182 | Fair 85.5% |
| Immigrants | Sudan | 34.2 /100 | #183 | Fair 85.5% |
| Immigrants | Oceania | 33.6 /100 | #184 | Fair 85.5% |
| Spanish | 32.8 /100 | #185 | Fair 85.4% |
| Spaniards | 31.9 /100 | #186 | Fair 85.4% |
Demographics Similar to Lithuanians by GED/Equivalency
In terms of ged/equivalency, the demographic groups most similar to Lithuanians are Immigrants from Iran (88.9%, a difference of 0.010%), Bulgarian (89.0%, a difference of 0.040%), Cypriot (88.9%, a difference of 0.040%), Okinawan (88.9%, a difference of 0.050%), and Norwegian (89.0%, a difference of 0.080%).
| Demographics | Rating | Rank | GED/Equivalency |
| Latvians | 100.0 /100 | #5 | Exceptional 89.2% |
| Thais | 100.0 /100 | #6 | Exceptional 89.1% |
| Eastern Europeans | 99.9 /100 | #7 | Exceptional 89.1% |
| Carpatho Rusyns | 99.9 /100 | #8 | Exceptional 89.1% |
| Chinese | 99.9 /100 | #9 | Exceptional 89.0% |
| Norwegians | 99.9 /100 | #10 | Exceptional 89.0% |
| Bulgarians | 99.9 /100 | #11 | Exceptional 89.0% |
| Lithuanians | 99.9 /100 | #12 | Exceptional 88.9% |
| Immigrants | Iran | 99.9 /100 | #13 | Exceptional 88.9% |
| Cypriots | 99.9 /100 | #14 | Exceptional 88.9% |
| Okinawans | 99.9 /100 | #15 | Exceptional 88.9% |
| Immigrants | Taiwan | 99.9 /100 | #16 | Exceptional 88.8% |
| Croatians | 99.9 /100 | #17 | Exceptional 88.8% |
| Slovenes | 99.9 /100 | #18 | Exceptional 88.8% |
| Swedes | 99.9 /100 | #19 | Exceptional 88.8% |