Aleut vs Kenyan GED/Equivalency
COMPARE
Aleut
Kenyan
GED/Equivalency
GED/Equivalency Comparison
Aleuts
Kenyans
85.6%
GED/EQUIVALENCY
40.5/ 100
METRIC RATING
179th/ 347
METRIC RANK
86.3%
GED/EQUIVALENCY
76.6/ 100
METRIC RATING
153rd/ 347
METRIC RANK
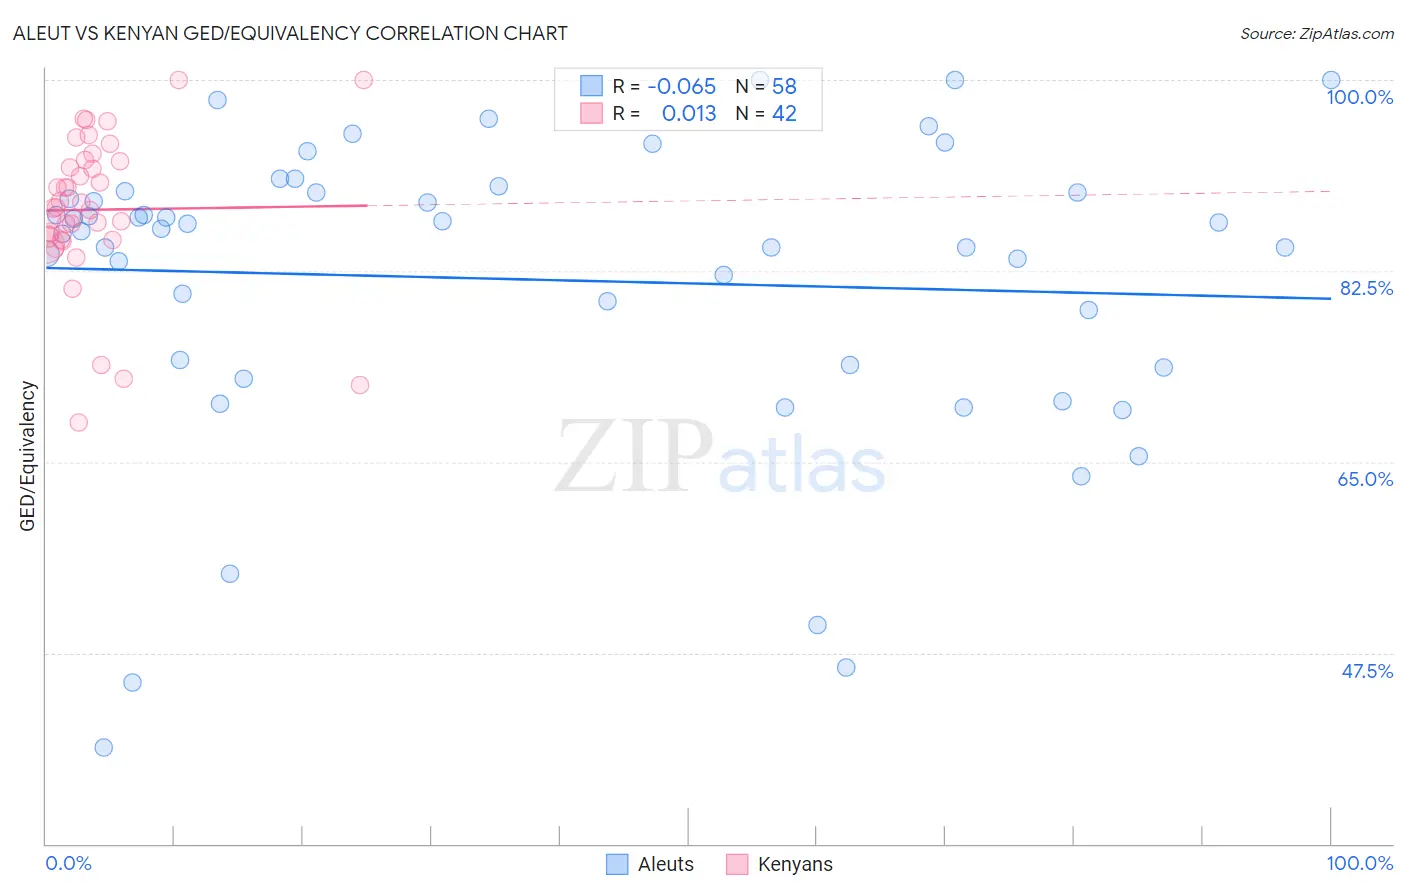
Aleut vs Kenyan GED/Equivalency Correlation Chart
The statistical analysis conducted on geographies consisting of 61,782,940 people shows a slight negative correlation between the proportion of Aleuts and percentage of population with at least ged/equivalency education in the United States with a correlation coefficient (R) of -0.065 and weighted average of 85.6%. Similarly, the statistical analysis conducted on geographies consisting of 168,244,481 people shows no correlation between the proportion of Kenyans and percentage of population with at least ged/equivalency education in the United States with a correlation coefficient (R) of 0.013 and weighted average of 86.3%, a difference of 0.81%.
GED/Equivalency Correlation Summary
| Measurement | Aleut | Kenyan |
| Minimum | 38.8% | 68.6% |
| Maximum | 100.0% | 100.0% |
| Range | 61.2% | 31.4% |
| Mean | 81.7% | 88.1% |
| Median | 86.3% | 88.3% |
| Interquartile 25% (IQ1) | 73.9% | 85.3% |
| Interquartile 75% (IQ3) | 89.7% | 92.6% |
| Interquartile Range (IQR) | 15.8% | 7.3% |
| Standard Deviation (Sample) | 13.9% | 6.9% |
| Standard Deviation (Population) | 13.8% | 6.8% |
Similar Demographics by GED/Equivalency
Demographics Similar to Aleuts by GED/Equivalency
In terms of ged/equivalency, the demographic groups most similar to Aleuts are Korean (85.6%, a difference of 0.020%), Immigrants from Southern Europe (85.5%, a difference of 0.040%), Moroccan (85.5%, a difference of 0.060%), Immigrants from Uganda (85.7%, a difference of 0.10%), and Sudanese (85.5%, a difference of 0.12%).
| Demographics | Rating | Rank | GED/Equivalency |
| Bermudans | 55.1 /100 | #172 | Average 85.8% |
| Immigrants | Venezuela | 50.7 /100 | #173 | Average 85.8% |
| Ottawa | 50.0 /100 | #174 | Average 85.8% |
| Immigrants | Bolivia | 49.8 /100 | #175 | Average 85.8% |
| Immigrants | Eastern Africa | 47.7 /100 | #176 | Average 85.7% |
| Immigrants | Uganda | 45.2 /100 | #177 | Average 85.7% |
| Koreans | 41.2 /100 | #178 | Average 85.6% |
| Aleuts | 40.5 /100 | #179 | Average 85.6% |
| Immigrants | Southern Europe | 38.4 /100 | #180 | Fair 85.5% |
| Moroccans | 37.7 /100 | #181 | Fair 85.5% |
| Sudanese | 35.2 /100 | #182 | Fair 85.5% |
| Immigrants | Sudan | 34.2 /100 | #183 | Fair 85.5% |
| Immigrants | Oceania | 33.6 /100 | #184 | Fair 85.5% |
| Spanish | 32.8 /100 | #185 | Fair 85.4% |
| Spaniards | 31.9 /100 | #186 | Fair 85.4% |
Demographics Similar to Kenyans by GED/Equivalency
In terms of ged/equivalency, the demographic groups most similar to Kenyans are Armenian (86.3%, a difference of 0.0%), Brazilian (86.3%, a difference of 0.020%), Immigrants from Bosnia and Herzegovina (86.3%, a difference of 0.040%), Iraqi (86.2%, a difference of 0.040%), and Immigrants from Western Asia (86.3%, a difference of 0.070%).
| Demographics | Rating | Rank | GED/Equivalency |
| Basques | 79.5 /100 | #146 | Good 86.4% |
| Immigrants | Northern Africa | 79.3 /100 | #147 | Good 86.3% |
| Immigrants | Poland | 79.3 /100 | #148 | Good 86.3% |
| Menominee | 79.3 /100 | #149 | Good 86.3% |
| Immigrants | Western Asia | 78.8 /100 | #150 | Good 86.3% |
| Immigrants | Bosnia and Herzegovina | 77.9 /100 | #151 | Good 86.3% |
| Brazilians | 77.2 /100 | #152 | Good 86.3% |
| Kenyans | 76.6 /100 | #153 | Good 86.3% |
| Armenians | 76.4 /100 | #154 | Good 86.3% |
| Iraqis | 75.2 /100 | #155 | Good 86.2% |
| Immigrants | Nepal | 73.3 /100 | #156 | Good 86.2% |
| Whites/Caucasians | 72.2 /100 | #157 | Good 86.2% |
| German Russians | 72.1 /100 | #158 | Good 86.2% |
| Immigrants | Kenya | 71.8 /100 | #159 | Good 86.2% |
| Immigrants | Morocco | 69.5 /100 | #160 | Good 86.1% |