Alaskan Athabascan vs Immigrants from the Azores 11th Grade
COMPARE
Alaskan Athabascan
Immigrants from the Azores
11th Grade
11th Grade Comparison
Alaskan Athabascans
Immigrants from the Azores
93.9%
11TH GRADE
99.8/ 100
METRIC RATING
66th/ 347
METRIC RANK
87.2%
11TH GRADE
0.0/ 100
METRIC RATING
332nd/ 347
METRIC RANK
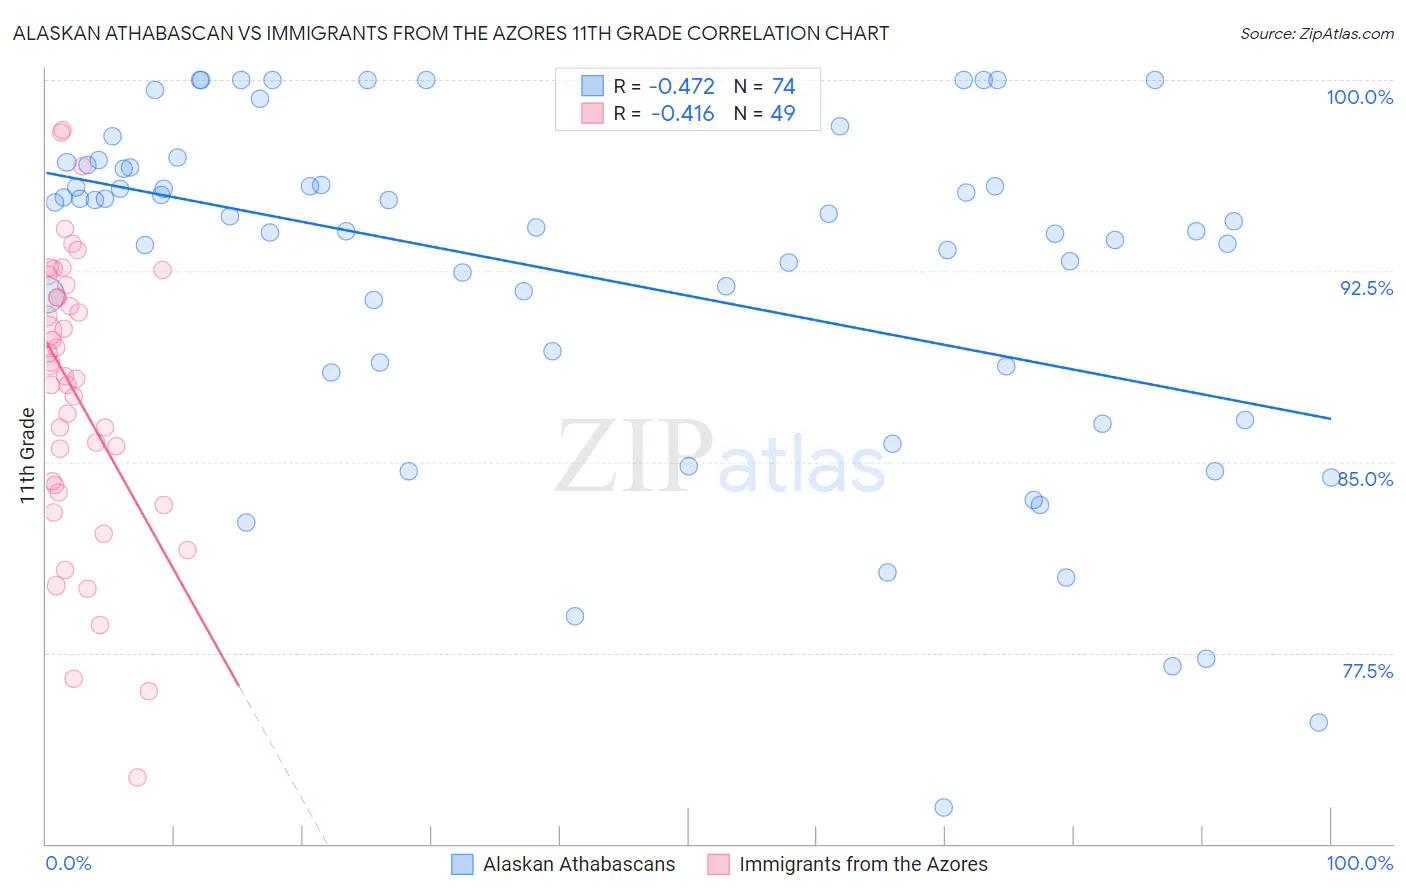
Alaskan Athabascan vs Immigrants from the Azores 11th Grade Correlation Chart
The statistical analysis conducted on geographies consisting of 45,820,226 people shows a moderate negative correlation between the proportion of Alaskan Athabascans and percentage of population with at least 11th grade education in the United States with a correlation coefficient (R) of -0.472 and weighted average of 93.9%. Similarly, the statistical analysis conducted on geographies consisting of 46,257,310 people shows a moderate negative correlation between the proportion of Immigrants from the Azores and percentage of population with at least 11th grade education in the United States with a correlation coefficient (R) of -0.416 and weighted average of 87.2%, a difference of 7.7%.
11th Grade Correlation Summary
| Measurement | Alaskan Athabascan | Immigrants from the Azores |
| Minimum | 71.4% | 72.6% |
| Maximum | 100.0% | 98.0% |
| Range | 28.6% | 25.4% |
| Mean | 92.3% | 87.6% |
| Median | 94.3% | 88.3% |
| Interquartile 25% (IQ1) | 88.7% | 83.9% |
| Interquartile 75% (IQ3) | 96.5% | 91.7% |
| Interquartile Range (IQR) | 7.8% | 7.8% |
| Standard Deviation (Sample) | 6.8% | 5.6% |
| Standard Deviation (Population) | 6.7% | 5.6% |
Similar Demographics by 11th Grade
Demographics Similar to Alaskan Athabascans by 11th Grade
In terms of 11th grade, the demographic groups most similar to Alaskan Athabascans are Immigrants from Netherlands (93.9%, a difference of 0.0%), Immigrants from Sweden (93.9%, a difference of 0.020%), Native Hawaiian (93.9%, a difference of 0.020%), Zimbabwean (93.9%, a difference of 0.020%), and Scotch-Irish (93.9%, a difference of 0.020%).
| Demographics | Rating | Rank | 11th Grade |
| Bhutanese | 99.8 /100 | #59 | Exceptional 94.0% |
| Okinawans | 99.8 /100 | #60 | Exceptional 94.0% |
| Immigrants | Belgium | 99.8 /100 | #61 | Exceptional 94.0% |
| Austrians | 99.8 /100 | #62 | Exceptional 94.0% |
| Ukrainians | 99.8 /100 | #63 | Exceptional 94.0% |
| Immigrants | Sweden | 99.8 /100 | #64 | Exceptional 93.9% |
| Native Hawaiians | 99.8 /100 | #65 | Exceptional 93.9% |
| Alaskan Athabascans | 99.8 /100 | #66 | Exceptional 93.9% |
| Immigrants | Netherlands | 99.8 /100 | #67 | Exceptional 93.9% |
| Zimbabweans | 99.8 /100 | #68 | Exceptional 93.9% |
| Scotch-Irish | 99.8 /100 | #69 | Exceptional 93.9% |
| Immigrants | England | 99.7 /100 | #70 | Exceptional 93.8% |
| Immigrants | South Africa | 99.7 /100 | #71 | Exceptional 93.8% |
| Immigrants | Japan | 99.7 /100 | #72 | Exceptional 93.8% |
| Romanians | 99.6 /100 | #73 | Exceptional 93.8% |
Demographics Similar to Immigrants from the Azores by 11th Grade
In terms of 11th grade, the demographic groups most similar to Immigrants from the Azores are Hispanic or Latino (87.3%, a difference of 0.090%), Honduran (87.4%, a difference of 0.16%), Immigrants from Yemen (87.1%, a difference of 0.17%), Houma (87.0%, a difference of 0.24%), and Central American (86.9%, a difference of 0.33%).
| Demographics | Rating | Rank | 11th Grade |
| Immigrants | Nicaragua | 0.0 /100 | #325 | Tragic 88.1% |
| Dominicans | 0.0 /100 | #326 | Tragic 87.7% |
| Immigrants | Cabo Verde | 0.0 /100 | #327 | Tragic 87.6% |
| Tohono O'odham | 0.0 /100 | #328 | Tragic 87.6% |
| Mexican American Indians | 0.0 /100 | #329 | Tragic 87.5% |
| Hondurans | 0.0 /100 | #330 | Tragic 87.4% |
| Hispanics or Latinos | 0.0 /100 | #331 | Tragic 87.3% |
| Immigrants | Azores | 0.0 /100 | #332 | Tragic 87.2% |
| Immigrants | Yemen | 0.0 /100 | #333 | Tragic 87.1% |
| Houma | 0.0 /100 | #334 | Tragic 87.0% |
| Central Americans | 0.0 /100 | #335 | Tragic 86.9% |
| Immigrants | Dominican Republic | 0.0 /100 | #336 | Tragic 86.9% |
| Immigrants | Honduras | 0.0 /100 | #337 | Tragic 86.9% |
| Immigrants | Latin America | 0.0 /100 | #338 | Tragic 86.8% |
| Guatemalans | 0.0 /100 | #339 | Tragic 86.4% |