Alaskan Athabascan vs Australian 11th Grade
COMPARE
Alaskan Athabascan
Australian
11th Grade
11th Grade Comparison
Alaskan Athabascans
Australians
93.9%
11TH GRADE
99.8/ 100
METRIC RATING
66th/ 347
METRIC RANK
94.1%
11TH GRADE
99.9/ 100
METRIC RATING
45th/ 347
METRIC RANK
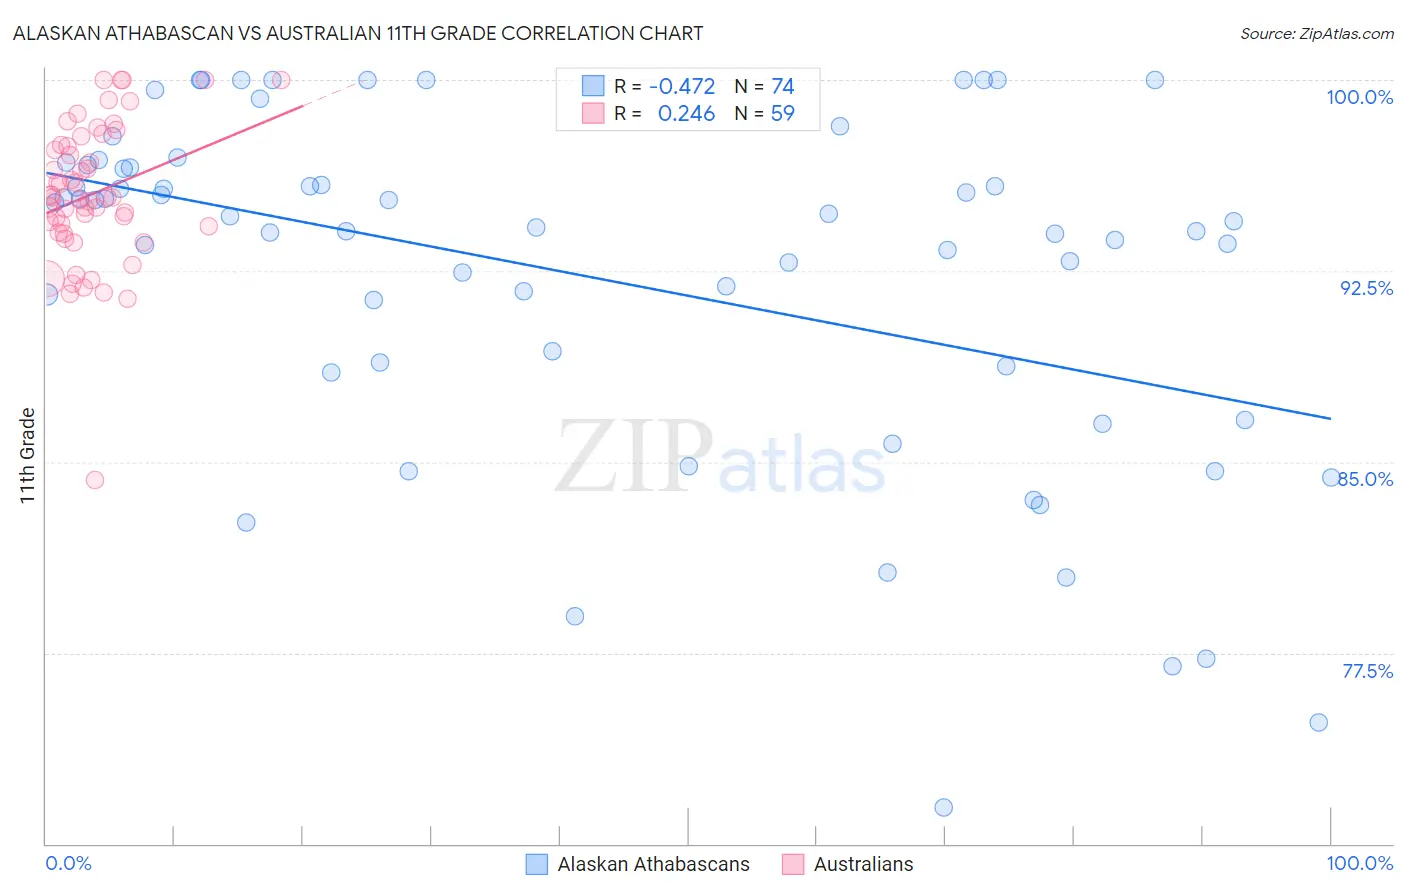
Alaskan Athabascan vs Australian 11th Grade Correlation Chart
The statistical analysis conducted on geographies consisting of 45,820,226 people shows a moderate negative correlation between the proportion of Alaskan Athabascans and percentage of population with at least 11th grade education in the United States with a correlation coefficient (R) of -0.472 and weighted average of 93.9%. Similarly, the statistical analysis conducted on geographies consisting of 224,153,693 people shows a weak positive correlation between the proportion of Australians and percentage of population with at least 11th grade education in the United States with a correlation coefficient (R) of 0.246 and weighted average of 94.1%, a difference of 0.18%.
11th Grade Correlation Summary
| Measurement | Alaskan Athabascan | Australian |
| Minimum | 71.4% | 84.3% |
| Maximum | 100.0% | 100.0% |
| Range | 28.6% | 15.7% |
| Mean | 92.3% | 95.5% |
| Median | 94.3% | 95.4% |
| Interquartile 25% (IQ1) | 88.7% | 94.0% |
| Interquartile 75% (IQ3) | 96.5% | 97.4% |
| Interquartile Range (IQR) | 7.8% | 3.4% |
| Standard Deviation (Sample) | 6.8% | 2.8% |
| Standard Deviation (Population) | 6.7% | 2.8% |
Similar Demographics by 11th Grade
Demographics Similar to Alaskan Athabascans by 11th Grade
In terms of 11th grade, the demographic groups most similar to Alaskan Athabascans are Immigrants from Netherlands (93.9%, a difference of 0.0%), Immigrants from Sweden (93.9%, a difference of 0.020%), Native Hawaiian (93.9%, a difference of 0.020%), Zimbabwean (93.9%, a difference of 0.020%), and Scotch-Irish (93.9%, a difference of 0.020%).
| Demographics | Rating | Rank | 11th Grade |
| Bhutanese | 99.8 /100 | #59 | Exceptional 94.0% |
| Okinawans | 99.8 /100 | #60 | Exceptional 94.0% |
| Immigrants | Belgium | 99.8 /100 | #61 | Exceptional 94.0% |
| Austrians | 99.8 /100 | #62 | Exceptional 94.0% |
| Ukrainians | 99.8 /100 | #63 | Exceptional 94.0% |
| Immigrants | Sweden | 99.8 /100 | #64 | Exceptional 93.9% |
| Native Hawaiians | 99.8 /100 | #65 | Exceptional 93.9% |
| Alaskan Athabascans | 99.8 /100 | #66 | Exceptional 93.9% |
| Immigrants | Netherlands | 99.8 /100 | #67 | Exceptional 93.9% |
| Zimbabweans | 99.8 /100 | #68 | Exceptional 93.9% |
| Scotch-Irish | 99.8 /100 | #69 | Exceptional 93.9% |
| Immigrants | England | 99.7 /100 | #70 | Exceptional 93.8% |
| Immigrants | South Africa | 99.7 /100 | #71 | Exceptional 93.8% |
| Immigrants | Japan | 99.7 /100 | #72 | Exceptional 93.8% |
| Romanians | 99.6 /100 | #73 | Exceptional 93.8% |
Demographics Similar to Australians by 11th Grade
In terms of 11th grade, the demographic groups most similar to Australians are Immigrants from Ireland (94.1%, a difference of 0.010%), Serbian (94.1%, a difference of 0.010%), Greek (94.1%, a difference of 0.020%), Filipino (94.1%, a difference of 0.020%), and Macedonian (94.1%, a difference of 0.020%).
| Demographics | Rating | Rank | 11th Grade |
| Hungarians | 99.9 /100 | #38 | Exceptional 94.2% |
| Immigrants | Lithuania | 99.9 /100 | #39 | Exceptional 94.1% |
| Thais | 99.9 /100 | #40 | Exceptional 94.1% |
| Cypriots | 99.9 /100 | #41 | Exceptional 94.1% |
| Immigrants | Austria | 99.9 /100 | #42 | Exceptional 94.1% |
| Greeks | 99.9 /100 | #43 | Exceptional 94.1% |
| Immigrants | Ireland | 99.9 /100 | #44 | Exceptional 94.1% |
| Australians | 99.9 /100 | #45 | Exceptional 94.1% |
| Serbians | 99.9 /100 | #46 | Exceptional 94.1% |
| Filipinos | 99.9 /100 | #47 | Exceptional 94.1% |
| Macedonians | 99.9 /100 | #48 | Exceptional 94.1% |
| Slavs | 99.9 /100 | #49 | Exceptional 94.1% |
| French | 99.9 /100 | #50 | Exceptional 94.1% |
| Turks | 99.9 /100 | #51 | Exceptional 94.0% |
| Immigrants | Canada | 99.9 /100 | #52 | Exceptional 94.0% |