Iraqi vs Immigrants from the Azores 11th Grade
COMPARE
Iraqi
Immigrants from the Azores
11th Grade
11th Grade Comparison
Iraqis
Immigrants from the Azores
92.8%
11TH GRADE
74.2/ 100
METRIC RATING
152nd/ 347
METRIC RANK
87.2%
11TH GRADE
0.0/ 100
METRIC RATING
332nd/ 347
METRIC RANK
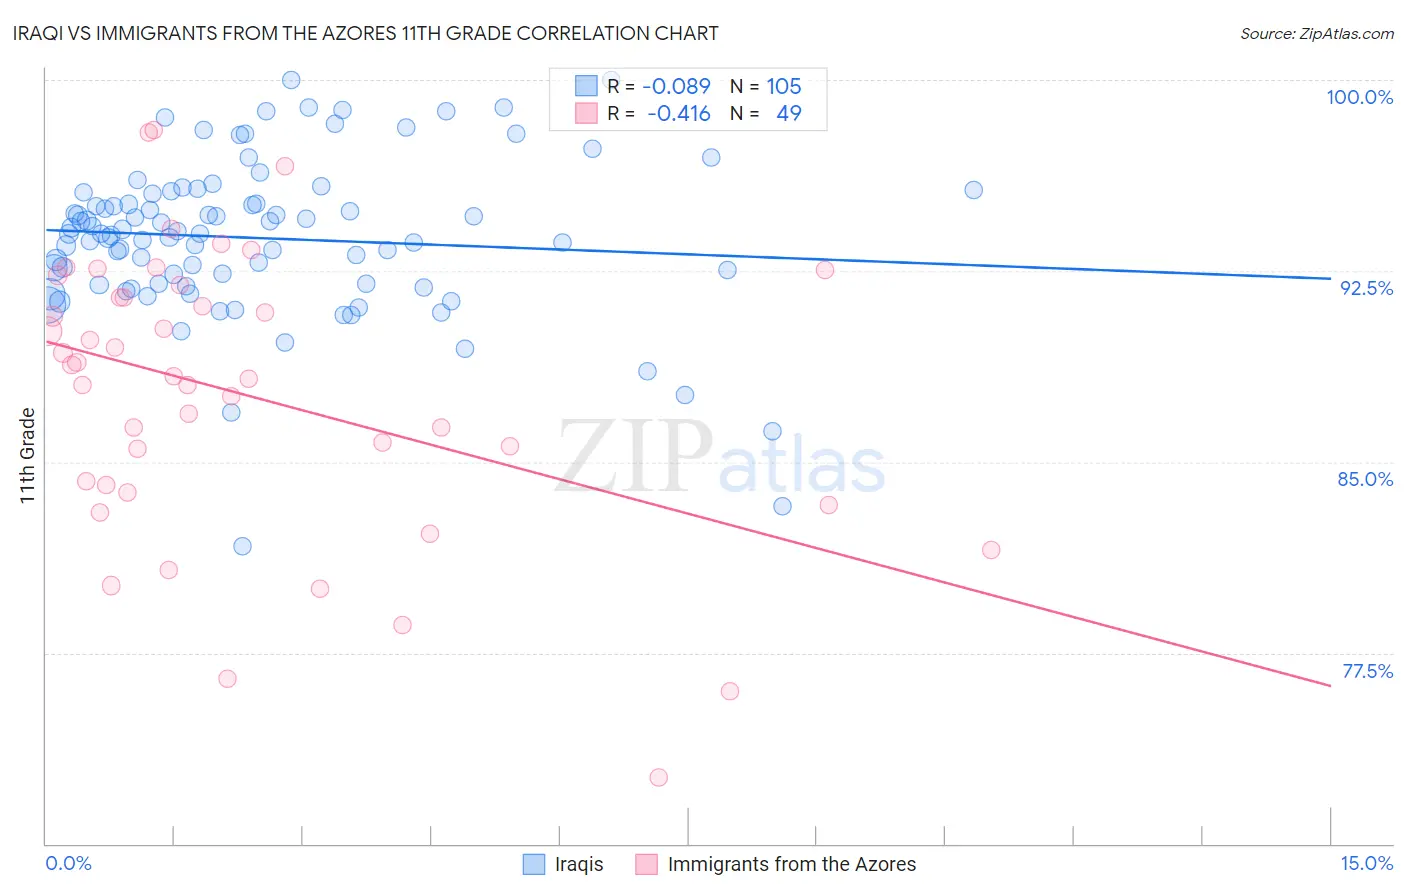
Iraqi vs Immigrants from the Azores 11th Grade Correlation Chart
The statistical analysis conducted on geographies consisting of 170,614,457 people shows a slight negative correlation between the proportion of Iraqis and percentage of population with at least 11th grade education in the United States with a correlation coefficient (R) of -0.089 and weighted average of 92.8%. Similarly, the statistical analysis conducted on geographies consisting of 46,257,310 people shows a moderate negative correlation between the proportion of Immigrants from the Azores and percentage of population with at least 11th grade education in the United States with a correlation coefficient (R) of -0.416 and weighted average of 87.2%, a difference of 6.3%.
11th Grade Correlation Summary
| Measurement | Iraqi | Immigrants from the Azores |
| Minimum | 81.7% | 72.6% |
| Maximum | 100.0% | 98.0% |
| Range | 18.3% | 25.4% |
| Mean | 93.8% | 87.6% |
| Median | 94.0% | 88.3% |
| Interquartile 25% (IQ1) | 92.0% | 83.9% |
| Interquartile 75% (IQ3) | 95.6% | 91.7% |
| Interquartile Range (IQR) | 3.6% | 7.8% |
| Standard Deviation (Sample) | 3.1% | 5.6% |
| Standard Deviation (Population) | 3.1% | 5.6% |
Similar Demographics by 11th Grade
Demographics Similar to Iraqis by 11th Grade
In terms of 11th grade, the demographic groups most similar to Iraqis are Potawatomi (92.8%, a difference of 0.0%), Brazilian (92.8%, a difference of 0.0%), Osage (92.7%, a difference of 0.010%), Argentinean (92.7%, a difference of 0.010%), and Immigrants from Spain (92.7%, a difference of 0.020%).
| Demographics | Rating | Rank | 11th Grade |
| Pakistanis | 79.6 /100 | #145 | Good 92.8% |
| Iroquois | 79.1 /100 | #146 | Good 92.8% |
| Immigrants | Kenya | 78.7 /100 | #147 | Good 92.8% |
| Hmong | 78.6 /100 | #148 | Good 92.8% |
| Immigrants | Poland | 78.5 /100 | #149 | Good 92.8% |
| Immigrants | Egypt | 77.5 /100 | #150 | Good 92.8% |
| Potawatomi | 74.3 /100 | #151 | Good 92.8% |
| Iraqis | 74.2 /100 | #152 | Good 92.8% |
| Brazilians | 73.9 /100 | #153 | Good 92.8% |
| Osage | 73.4 /100 | #154 | Good 92.7% |
| Argentineans | 73.4 /100 | #155 | Good 92.7% |
| Immigrants | Spain | 73.0 /100 | #156 | Good 92.7% |
| Immigrants | Eastern Asia | 72.6 /100 | #157 | Good 92.7% |
| Immigrants | Venezuela | 72.0 /100 | #158 | Good 92.7% |
| Americans | 71.7 /100 | #159 | Good 92.7% |
Demographics Similar to Immigrants from the Azores by 11th Grade
In terms of 11th grade, the demographic groups most similar to Immigrants from the Azores are Hispanic or Latino (87.3%, a difference of 0.090%), Honduran (87.4%, a difference of 0.16%), Immigrants from Yemen (87.1%, a difference of 0.17%), Houma (87.0%, a difference of 0.24%), and Central American (86.9%, a difference of 0.33%).
| Demographics | Rating | Rank | 11th Grade |
| Immigrants | Nicaragua | 0.0 /100 | #325 | Tragic 88.1% |
| Dominicans | 0.0 /100 | #326 | Tragic 87.7% |
| Immigrants | Cabo Verde | 0.0 /100 | #327 | Tragic 87.6% |
| Tohono O'odham | 0.0 /100 | #328 | Tragic 87.6% |
| Mexican American Indians | 0.0 /100 | #329 | Tragic 87.5% |
| Hondurans | 0.0 /100 | #330 | Tragic 87.4% |
| Hispanics or Latinos | 0.0 /100 | #331 | Tragic 87.3% |
| Immigrants | Azores | 0.0 /100 | #332 | Tragic 87.2% |
| Immigrants | Yemen | 0.0 /100 | #333 | Tragic 87.1% |
| Houma | 0.0 /100 | #334 | Tragic 87.0% |
| Central Americans | 0.0 /100 | #335 | Tragic 86.9% |
| Immigrants | Dominican Republic | 0.0 /100 | #336 | Tragic 86.9% |
| Immigrants | Honduras | 0.0 /100 | #337 | Tragic 86.9% |
| Immigrants | Latin America | 0.0 /100 | #338 | Tragic 86.8% |
| Guatemalans | 0.0 /100 | #339 | Tragic 86.4% |