Immigrants from Hong Kong vs Immigrants from the Azores 11th Grade
COMPARE
Immigrants from Hong Kong
Immigrants from the Azores
11th Grade
11th Grade Comparison
Immigrants from Hong Kong
Immigrants from the Azores
92.2%
11TH GRADE
23.3/ 100
METRIC RATING
204th/ 347
METRIC RANK
87.2%
11TH GRADE
0.0/ 100
METRIC RATING
332nd/ 347
METRIC RANK
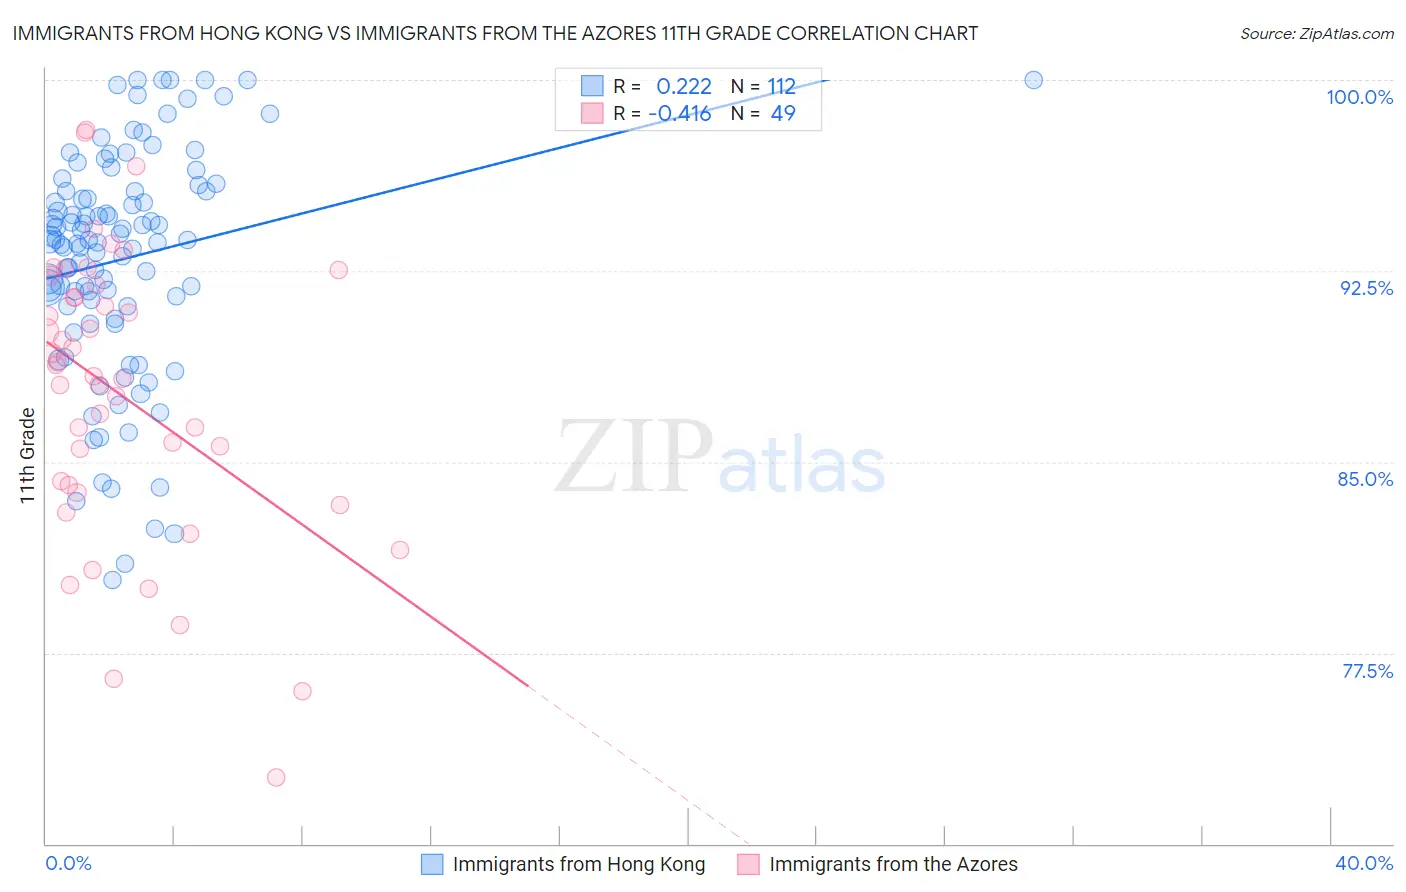
Immigrants from Hong Kong vs Immigrants from the Azores 11th Grade Correlation Chart
The statistical analysis conducted on geographies consisting of 253,990,250 people shows a weak positive correlation between the proportion of Immigrants from Hong Kong and percentage of population with at least 11th grade education in the United States with a correlation coefficient (R) of 0.222 and weighted average of 92.2%. Similarly, the statistical analysis conducted on geographies consisting of 46,257,310 people shows a moderate negative correlation between the proportion of Immigrants from the Azores and percentage of population with at least 11th grade education in the United States with a correlation coefficient (R) of -0.416 and weighted average of 87.2%, a difference of 5.8%.
11th Grade Correlation Summary
| Measurement | Immigrants from Hong Kong | Immigrants from the Azores |
| Minimum | 80.4% | 72.6% |
| Maximum | 100.0% | 98.0% |
| Range | 19.6% | 25.4% |
| Mean | 93.0% | 87.6% |
| Median | 93.7% | 88.3% |
| Interquartile 25% (IQ1) | 91.1% | 83.9% |
| Interquartile 75% (IQ3) | 95.6% | 91.7% |
| Interquartile Range (IQR) | 4.5% | 7.8% |
| Standard Deviation (Sample) | 4.5% | 5.6% |
| Standard Deviation (Population) | 4.4% | 5.6% |
Similar Demographics by 11th Grade
Demographics Similar to Immigrants from Hong Kong by 11th Grade
In terms of 11th grade, the demographic groups most similar to Immigrants from Hong Kong are Immigrants from Sudan (92.3%, a difference of 0.0%), Kiowa (92.2%, a difference of 0.0%), Bolivian (92.2%, a difference of 0.0%), Immigrants from Eastern Africa (92.3%, a difference of 0.010%), and Immigrants from Oceania (92.2%, a difference of 0.010%).
| Demographics | Rating | Rank | 11th Grade |
| Marshallese | 26.0 /100 | #197 | Fair 92.3% |
| Hawaiians | 25.5 /100 | #198 | Fair 92.3% |
| Immigrants | Uganda | 25.2 /100 | #199 | Fair 92.3% |
| Samoans | 25.1 /100 | #200 | Fair 92.3% |
| Immigrants | China | 25.1 /100 | #201 | Fair 92.3% |
| Immigrants | Eastern Africa | 24.1 /100 | #202 | Fair 92.3% |
| Immigrants | Sudan | 23.5 /100 | #203 | Fair 92.3% |
| Immigrants | Hong Kong | 23.3 /100 | #204 | Fair 92.2% |
| Kiowa | 23.2 /100 | #205 | Fair 92.2% |
| Bolivians | 23.2 /100 | #206 | Fair 92.2% |
| Immigrants | Oceania | 22.4 /100 | #207 | Fair 92.2% |
| Colville | 21.8 /100 | #208 | Fair 92.2% |
| Tongans | 19.8 /100 | #209 | Poor 92.2% |
| Ethiopians | 18.8 /100 | #210 | Poor 92.2% |
| Immigrants | Micronesia | 17.7 /100 | #211 | Poor 92.2% |
Demographics Similar to Immigrants from the Azores by 11th Grade
In terms of 11th grade, the demographic groups most similar to Immigrants from the Azores are Hispanic or Latino (87.3%, a difference of 0.090%), Honduran (87.4%, a difference of 0.16%), Immigrants from Yemen (87.1%, a difference of 0.17%), Houma (87.0%, a difference of 0.24%), and Central American (86.9%, a difference of 0.33%).
| Demographics | Rating | Rank | 11th Grade |
| Immigrants | Nicaragua | 0.0 /100 | #325 | Tragic 88.1% |
| Dominicans | 0.0 /100 | #326 | Tragic 87.7% |
| Immigrants | Cabo Verde | 0.0 /100 | #327 | Tragic 87.6% |
| Tohono O'odham | 0.0 /100 | #328 | Tragic 87.6% |
| Mexican American Indians | 0.0 /100 | #329 | Tragic 87.5% |
| Hondurans | 0.0 /100 | #330 | Tragic 87.4% |
| Hispanics or Latinos | 0.0 /100 | #331 | Tragic 87.3% |
| Immigrants | Azores | 0.0 /100 | #332 | Tragic 87.2% |
| Immigrants | Yemen | 0.0 /100 | #333 | Tragic 87.1% |
| Houma | 0.0 /100 | #334 | Tragic 87.0% |
| Central Americans | 0.0 /100 | #335 | Tragic 86.9% |
| Immigrants | Dominican Republic | 0.0 /100 | #336 | Tragic 86.9% |
| Immigrants | Honduras | 0.0 /100 | #337 | Tragic 86.9% |
| Immigrants | Latin America | 0.0 /100 | #338 | Tragic 86.8% |
| Guatemalans | 0.0 /100 | #339 | Tragic 86.4% |