Yup'ik vs Somali Male Disability
COMPARE
Yup'ik
Somali
Male Disability
Male Disability Comparison
Yup'ik
Somalis
12.8%
MALE DISABILITY
0.0/ 100
METRIC RATING
288th/ 347
METRIC RANK
11.4%
MALE DISABILITY
18.2/ 100
METRIC RATING
197th/ 347
METRIC RANK
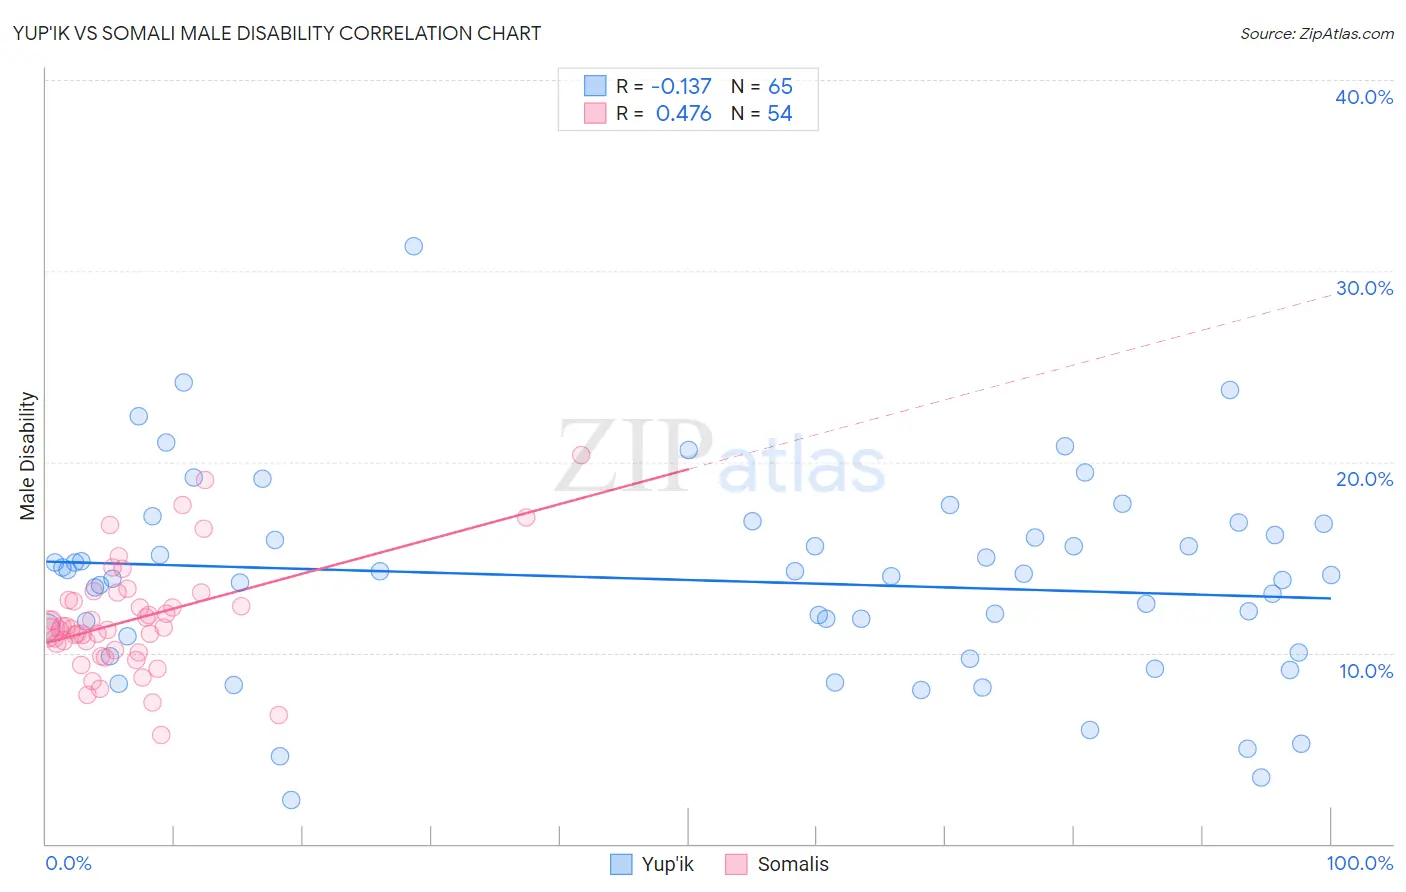
Yup'ik vs Somali Male Disability Correlation Chart
The statistical analysis conducted on geographies consisting of 39,960,861 people shows a poor negative correlation between the proportion of Yup'ik and percentage of males with a disability in the United States with a correlation coefficient (R) of -0.137 and weighted average of 12.8%. Similarly, the statistical analysis conducted on geographies consisting of 99,314,989 people shows a moderate positive correlation between the proportion of Somalis and percentage of males with a disability in the United States with a correlation coefficient (R) of 0.476 and weighted average of 11.4%, a difference of 11.7%.
Male Disability Correlation Summary
| Measurement | Yup'ik | Somali |
| Minimum | 2.3% | 5.7% |
| Maximum | 31.3% | 20.4% |
| Range | 29.0% | 14.6% |
| Mean | 13.8% | 11.8% |
| Median | 14.1% | 11.2% |
| Interquartile 25% (IQ1) | 10.4% | 10.1% |
| Interquartile 75% (IQ3) | 16.4% | 12.7% |
| Interquartile Range (IQR) | 6.0% | 2.6% |
| Standard Deviation (Sample) | 5.2% | 2.9% |
| Standard Deviation (Population) | 5.2% | 2.9% |
Similar Demographics by Male Disability
Demographics Similar to Yup'ik by Male Disability
In terms of male disability, the demographic groups most similar to Yup'ik are Cape Verdean (12.8%, a difference of 0.19%), Immigrants from Cabo Verde (12.8%, a difference of 0.19%), Scottish (12.8%, a difference of 0.26%), Spanish (12.7%, a difference of 0.31%), and Welsh (12.7%, a difference of 0.31%).
| Demographics | Rating | Rank | Male Disability |
| Sioux | 0.0 /100 | #281 | Tragic 12.7% |
| Irish | 0.0 /100 | #282 | Tragic 12.7% |
| Germans | 0.0 /100 | #283 | Tragic 12.7% |
| Spanish | 0.0 /100 | #284 | Tragic 12.7% |
| Welsh | 0.0 /100 | #285 | Tragic 12.7% |
| Scottish | 0.0 /100 | #286 | Tragic 12.8% |
| Cape Verdeans | 0.0 /100 | #287 | Tragic 12.8% |
| Yup'ik | 0.0 /100 | #288 | Tragic 12.8% |
| Immigrants | Cabo Verde | 0.0 /100 | #289 | Tragic 12.8% |
| Pima | 0.0 /100 | #290 | Tragic 12.8% |
| Whites/Caucasians | 0.0 /100 | #291 | Tragic 12.8% |
| English | 0.0 /100 | #292 | Tragic 12.8% |
| Yaqui | 0.0 /100 | #293 | Tragic 12.9% |
| Marshallese | 0.0 /100 | #294 | Tragic 12.9% |
| Immigrants | Micronesia | 0.0 /100 | #295 | Tragic 12.9% |
Demographics Similar to Somalis by Male Disability
In terms of male disability, the demographic groups most similar to Somalis are West Indian (11.4%, a difference of 0.020%), Immigrants from Jamaica (11.5%, a difference of 0.18%), Immigrants from Oceania (11.4%, a difference of 0.23%), Belizean (11.4%, a difference of 0.26%), and Lebanese (11.5%, a difference of 0.27%).
| Demographics | Rating | Rank | Male Disability |
| Immigrants | Bosnia and Herzegovina | 25.4 /100 | #190 | Fair 11.4% |
| Senegalese | 23.2 /100 | #191 | Fair 11.4% |
| Assyrians/Chaldeans/Syriacs | 23.2 /100 | #192 | Fair 11.4% |
| Greeks | 22.2 /100 | #193 | Fair 11.4% |
| Belizeans | 21.2 /100 | #194 | Fair 11.4% |
| Immigrants | Oceania | 20.9 /100 | #195 | Fair 11.4% |
| West Indians | 18.4 /100 | #196 | Poor 11.4% |
| Somalis | 18.2 /100 | #197 | Poor 11.4% |
| Immigrants | Jamaica | 16.3 /100 | #198 | Poor 11.5% |
| Lebanese | 15.4 /100 | #199 | Poor 11.5% |
| Immigrants | Iraq | 13.0 /100 | #200 | Poor 11.5% |
| Immigrants | Panama | 13.0 /100 | #201 | Poor 11.5% |
| Immigrants | Mexico | 12.6 /100 | #202 | Poor 11.5% |
| Jamaicans | 10.9 /100 | #203 | Poor 11.5% |
| Immigrants | Cambodia | 10.8 /100 | #204 | Poor 11.5% |