Venezuelan vs Immigrants from Colombia Female Disability
COMPARE
Venezuelan
Immigrants from Colombia
Female Disability
Female Disability Comparison
Venezuelans
Immigrants from Colombia
11.0%
FEMALE DISABILITY
100.0/ 100
METRIC RATING
23rd/ 347
METRIC RANK
11.4%
FEMALE DISABILITY
99.9/ 100
METRIC RATING
63rd/ 347
METRIC RANK
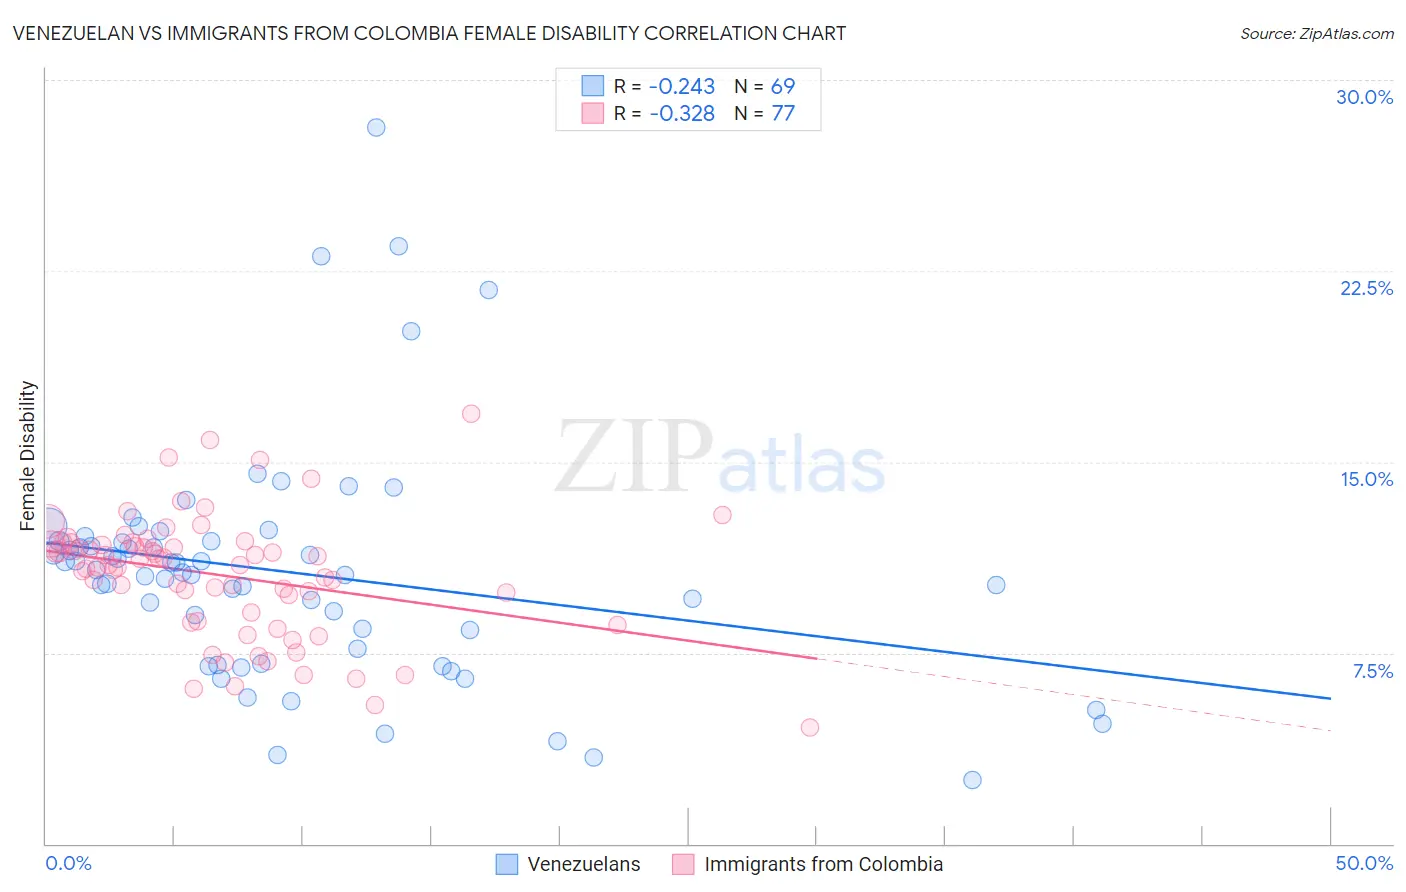
Venezuelan vs Immigrants from Colombia Female Disability Correlation Chart
The statistical analysis conducted on geographies consisting of 306,290,723 people shows a weak negative correlation between the proportion of Venezuelans and percentage of females with a disability in the United States with a correlation coefficient (R) of -0.243 and weighted average of 11.0%. Similarly, the statistical analysis conducted on geographies consisting of 378,634,617 people shows a mild negative correlation between the proportion of Immigrants from Colombia and percentage of females with a disability in the United States with a correlation coefficient (R) of -0.328 and weighted average of 11.4%, a difference of 4.4%.
Female Disability Correlation Summary
| Measurement | Venezuelan | Immigrants from Colombia |
| Minimum | 2.5% | 4.6% |
| Maximum | 28.1% | 16.9% |
| Range | 25.6% | 12.3% |
| Mean | 10.6% | 10.6% |
| Median | 10.7% | 11.0% |
| Interquartile 25% (IQ1) | 7.4% | 8.9% |
| Interquartile 75% (IQ3) | 11.9% | 11.8% |
| Interquartile Range (IQR) | 4.5% | 2.9% |
| Standard Deviation (Sample) | 4.6% | 2.4% |
| Standard Deviation (Population) | 4.6% | 2.4% |
Similar Demographics by Female Disability
Demographics Similar to Venezuelans by Female Disability
In terms of female disability, the demographic groups most similar to Venezuelans are Immigrants from Sri Lanka (10.9%, a difference of 0.22%), Asian (10.9%, a difference of 0.35%), Immigrants from Argentina (11.0%, a difference of 0.57%), Immigrants from Asia (11.0%, a difference of 0.59%), and Argentinean (11.0%, a difference of 0.64%).
| Demographics | Rating | Rank | Female Disability |
| Okinawans | 100.0 /100 | #16 | Exceptional 10.8% |
| Indians (Asian) | 100.0 /100 | #17 | Exceptional 10.8% |
| Immigrants | Iran | 100.0 /100 | #18 | Exceptional 10.8% |
| Immigrants | Venezuela | 100.0 /100 | #19 | Exceptional 10.9% |
| Immigrants | Pakistan | 100.0 /100 | #20 | Exceptional 10.9% |
| Asians | 100.0 /100 | #21 | Exceptional 10.9% |
| Immigrants | Sri Lanka | 100.0 /100 | #22 | Exceptional 10.9% |
| Venezuelans | 100.0 /100 | #23 | Exceptional 11.0% |
| Immigrants | Argentina | 100.0 /100 | #24 | Exceptional 11.0% |
| Immigrants | Asia | 100.0 /100 | #25 | Exceptional 11.0% |
| Argentineans | 100.0 /100 | #26 | Exceptional 11.0% |
| Immigrants | Turkey | 100.0 /100 | #27 | Exceptional 11.1% |
| Egyptians | 100.0 /100 | #28 | Exceptional 11.1% |
| Immigrants | Malaysia | 100.0 /100 | #29 | Exceptional 11.1% |
| Turks | 100.0 /100 | #30 | Exceptional 11.1% |
Demographics Similar to Immigrants from Colombia by Female Disability
In terms of female disability, the demographic groups most similar to Immigrants from Colombia are Immigrants from El Salvador (11.4%, a difference of 0.070%), Immigrants from South America (11.4%, a difference of 0.090%), Sri Lankan (11.4%, a difference of 0.10%), Immigrants from France (11.4%, a difference of 0.20%), and Immigrants from Bulgaria (11.4%, a difference of 0.26%).
| Demographics | Rating | Rank | Female Disability |
| Taiwanese | 99.9 /100 | #56 | Exceptional 11.4% |
| South Americans | 99.9 /100 | #57 | Exceptional 11.4% |
| Laotians | 99.9 /100 | #58 | Exceptional 11.4% |
| Immigrants | Spain | 99.9 /100 | #59 | Exceptional 11.4% |
| Immigrants | Bulgaria | 99.9 /100 | #60 | Exceptional 11.4% |
| Immigrants | France | 99.9 /100 | #61 | Exceptional 11.4% |
| Sri Lankans | 99.9 /100 | #62 | Exceptional 11.4% |
| Immigrants | Colombia | 99.9 /100 | #63 | Exceptional 11.4% |
| Immigrants | El Salvador | 99.9 /100 | #64 | Exceptional 11.4% |
| Immigrants | South America | 99.9 /100 | #65 | Exceptional 11.4% |
| Salvadorans | 99.8 /100 | #66 | Exceptional 11.5% |
| Immigrants | Vietnam | 99.8 /100 | #67 | Exceptional 11.5% |
| Immigrants | Northern Africa | 99.8 /100 | #68 | Exceptional 11.5% |
| Colombians | 99.8 /100 | #69 | Exceptional 11.5% |
| Immigrants | Chile | 99.8 /100 | #70 | Exceptional 11.5% |