Subsaharan African vs Tohono O'odham Disability Age 35 to 64
COMPARE
Subsaharan African
Tohono O'odham
Disability Age 35 to 64
Disability Age 35 to 64 Comparison
Sub-Saharan Africans
Tohono O'odham
12.6%
DISABILITY AGE 35 TO 64
0.2/ 100
METRIC RATING
267th/ 347
METRIC RANK
16.7%
DISABILITY AGE 35 TO 64
0.0/ 100
METRIC RATING
342nd/ 347
METRIC RANK
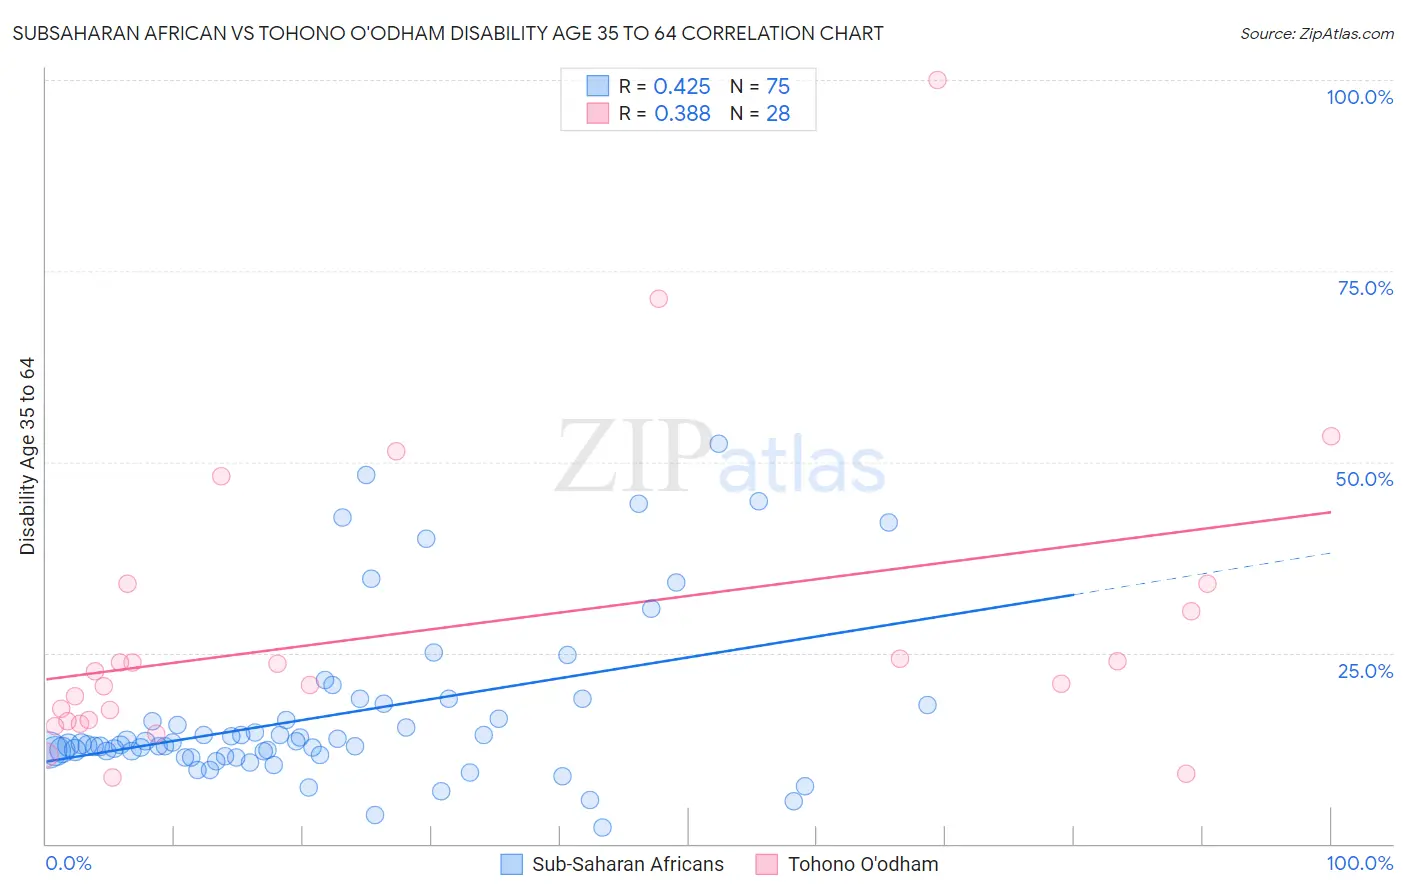
Subsaharan African vs Tohono O'odham Disability Age 35 to 64 Correlation Chart
The statistical analysis conducted on geographies consisting of 507,479,662 people shows a moderate positive correlation between the proportion of Sub-Saharan Africans and percentage of population with a disability between the ages 34 and 64 in the United States with a correlation coefficient (R) of 0.425 and weighted average of 12.6%. Similarly, the statistical analysis conducted on geographies consisting of 58,717,576 people shows a mild positive correlation between the proportion of Tohono O'odham and percentage of population with a disability between the ages 34 and 64 in the United States with a correlation coefficient (R) of 0.388 and weighted average of 16.7%, a difference of 32.5%.
Disability Age 35 to 64 Correlation Summary
| Measurement | Subsaharan African | Tohono O'odham |
| Minimum | 2.2% | 8.7% |
| Maximum | 52.4% | 100.0% |
| Range | 50.2% | 91.3% |
| Mean | 16.8% | 28.2% |
| Median | 12.9% | 21.7% |
| Interquartile 25% (IQ1) | 11.6% | 16.2% |
| Interquartile 75% (IQ3) | 18.2% | 32.2% |
| Interquartile Range (IQR) | 6.5% | 16.0% |
| Standard Deviation (Sample) | 10.7% | 20.2% |
| Standard Deviation (Population) | 10.7% | 19.9% |
Similar Demographics by Disability Age 35 to 64
Demographics Similar to Sub-Saharan Africans by Disability Age 35 to 64
In terms of disability age 35 to 64, the demographic groups most similar to Sub-Saharan Africans are White/Caucasian (12.6%, a difference of 0.16%), Immigrants from Dominica (12.7%, a difference of 0.18%), Spanish (12.7%, a difference of 0.28%), French (12.7%, a difference of 0.33%), and Marshallese (12.5%, a difference of 0.86%).
| Demographics | Rating | Rank | Disability Age 35 to 64 |
| German Russians | 0.5 /100 | #260 | Tragic 12.5% |
| Malaysians | 0.5 /100 | #261 | Tragic 12.5% |
| Senegalese | 0.5 /100 | #262 | Tragic 12.5% |
| Immigrants | Zaire | 0.4 /100 | #263 | Tragic 12.5% |
| Immigrants | Portugal | 0.4 /100 | #264 | Tragic 12.5% |
| Marshallese | 0.4 /100 | #265 | Tragic 12.5% |
| Whites/Caucasians | 0.3 /100 | #266 | Tragic 12.6% |
| Sub-Saharan Africans | 0.2 /100 | #267 | Tragic 12.6% |
| Immigrants | Dominica | 0.2 /100 | #268 | Tragic 12.7% |
| Spanish | 0.2 /100 | #269 | Tragic 12.7% |
| French | 0.2 /100 | #270 | Tragic 12.7% |
| Nepalese | 0.1 /100 | #271 | Tragic 12.8% |
| U.S. Virgin Islanders | 0.1 /100 | #272 | Tragic 12.8% |
| Pennsylvania Germans | 0.1 /100 | #273 | Tragic 12.8% |
| Celtics | 0.1 /100 | #274 | Tragic 12.9% |
Demographics Similar to Tohono O'odham by Disability Age 35 to 64
In terms of disability age 35 to 64, the demographic groups most similar to Tohono O'odham are Tsimshian (16.7%, a difference of 0.11%), Creek (16.9%, a difference of 0.86%), Yup'ik (16.9%, a difference of 1.2%), Choctaw (16.4%, a difference of 2.0%), and Kiowa (17.4%, a difference of 3.7%).
| Demographics | Rating | Rank | Disability Age 35 to 64 |
| Yuman | 0.0 /100 | #333 | Tragic 15.8% |
| Colville | 0.0 /100 | #334 | Tragic 15.8% |
| Seminole | 0.0 /100 | #335 | Tragic 15.9% |
| Menominee | 0.0 /100 | #336 | Tragic 15.9% |
| Puerto Ricans | 0.0 /100 | #337 | Tragic 15.9% |
| Chickasaw | 0.0 /100 | #338 | Tragic 16.1% |
| Pima | 0.0 /100 | #339 | Tragic 16.1% |
| Choctaw | 0.0 /100 | #340 | Tragic 16.4% |
| Tsimshian | 0.0 /100 | #341 | Tragic 16.7% |
| Tohono O'odham | 0.0 /100 | #342 | Tragic 16.7% |
| Creek | 0.0 /100 | #343 | Tragic 16.9% |
| Yup'ik | 0.0 /100 | #344 | Tragic 16.9% |
| Kiowa | 0.0 /100 | #345 | Tragic 17.4% |
| Lumbee | 0.0 /100 | #346 | Tragic 17.6% |
| Houma | 0.0 /100 | #347 | Tragic 18.7% |