Subsaharan African vs Greek Disability Age 35 to 64
COMPARE
Subsaharan African
Greek
Disability Age 35 to 64
Disability Age 35 to 64 Comparison
Sub-Saharan Africans
Greeks
12.6%
DISABILITY AGE 35 TO 64
0.2/ 100
METRIC RATING
267th/ 347
METRIC RANK
10.7%
DISABILITY AGE 35 TO 64
92.3/ 100
METRIC RATING
135th/ 347
METRIC RANK
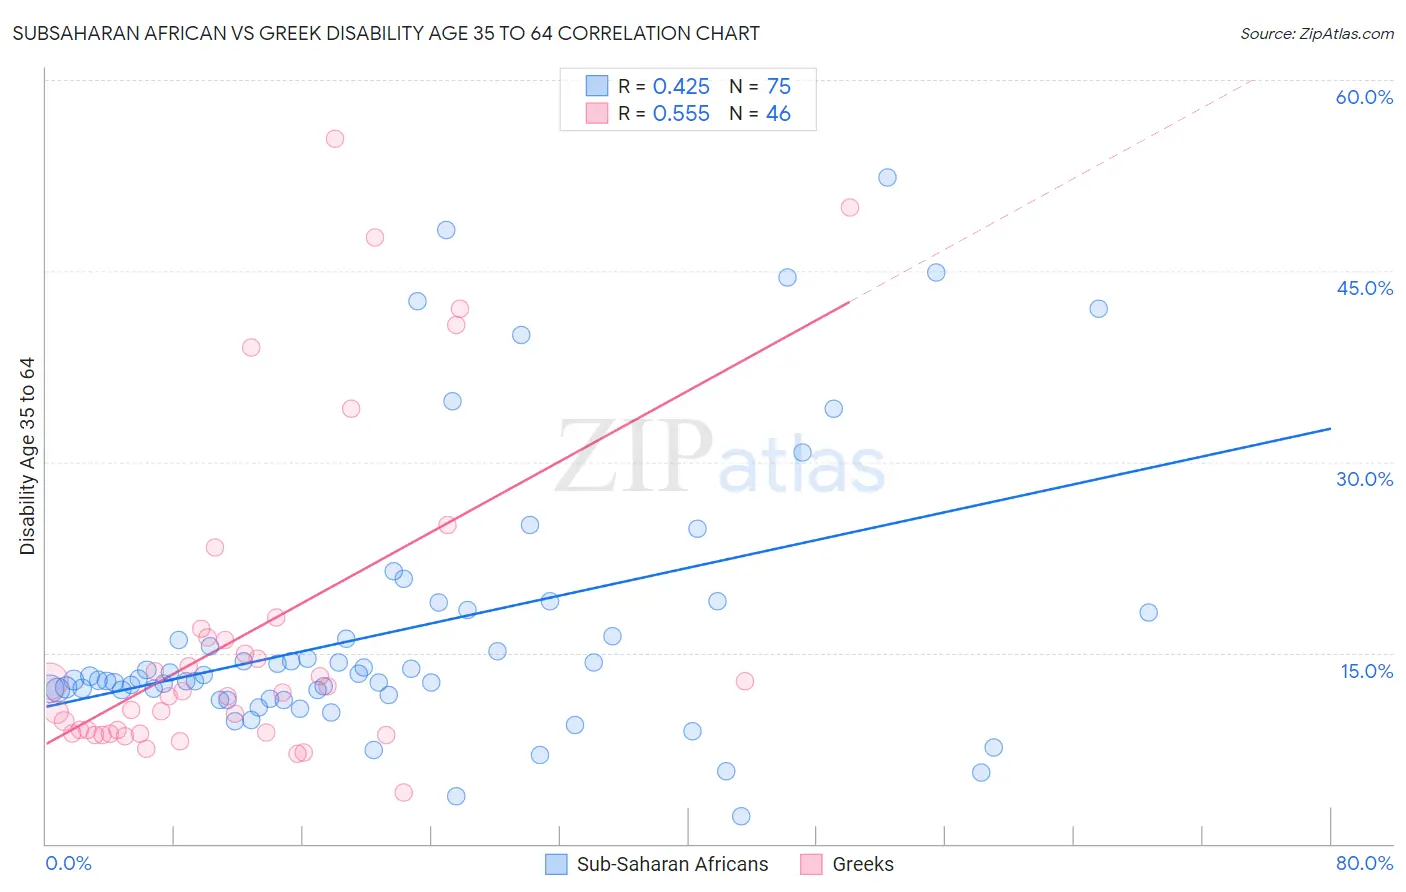
Subsaharan African vs Greek Disability Age 35 to 64 Correlation Chart
The statistical analysis conducted on geographies consisting of 507,479,662 people shows a moderate positive correlation between the proportion of Sub-Saharan Africans and percentage of population with a disability between the ages 34 and 64 in the United States with a correlation coefficient (R) of 0.425 and weighted average of 12.6%. Similarly, the statistical analysis conducted on geographies consisting of 482,222,080 people shows a substantial positive correlation between the proportion of Greeks and percentage of population with a disability between the ages 34 and 64 in the United States with a correlation coefficient (R) of 0.555 and weighted average of 10.7%, a difference of 18.1%.
Disability Age 35 to 64 Correlation Summary
| Measurement | Subsaharan African | Greek |
| Minimum | 2.2% | 4.0% |
| Maximum | 52.4% | 55.4% |
| Range | 50.2% | 51.4% |
| Mean | 16.8% | 16.5% |
| Median | 12.9% | 11.8% |
| Interquartile 25% (IQ1) | 11.6% | 8.7% |
| Interquartile 75% (IQ3) | 18.2% | 16.2% |
| Interquartile Range (IQR) | 6.5% | 7.5% |
| Standard Deviation (Sample) | 10.7% | 12.7% |
| Standard Deviation (Population) | 10.7% | 12.6% |
Similar Demographics by Disability Age 35 to 64
Demographics Similar to Sub-Saharan Africans by Disability Age 35 to 64
In terms of disability age 35 to 64, the demographic groups most similar to Sub-Saharan Africans are White/Caucasian (12.6%, a difference of 0.16%), Immigrants from Dominica (12.7%, a difference of 0.18%), Spanish (12.7%, a difference of 0.28%), French (12.7%, a difference of 0.33%), and Marshallese (12.5%, a difference of 0.86%).
| Demographics | Rating | Rank | Disability Age 35 to 64 |
| German Russians | 0.5 /100 | #260 | Tragic 12.5% |
| Malaysians | 0.5 /100 | #261 | Tragic 12.5% |
| Senegalese | 0.5 /100 | #262 | Tragic 12.5% |
| Immigrants | Zaire | 0.4 /100 | #263 | Tragic 12.5% |
| Immigrants | Portugal | 0.4 /100 | #264 | Tragic 12.5% |
| Marshallese | 0.4 /100 | #265 | Tragic 12.5% |
| Whites/Caucasians | 0.3 /100 | #266 | Tragic 12.6% |
| Sub-Saharan Africans | 0.2 /100 | #267 | Tragic 12.6% |
| Immigrants | Dominica | 0.2 /100 | #268 | Tragic 12.7% |
| Spanish | 0.2 /100 | #269 | Tragic 12.7% |
| French | 0.2 /100 | #270 | Tragic 12.7% |
| Nepalese | 0.1 /100 | #271 | Tragic 12.8% |
| U.S. Virgin Islanders | 0.1 /100 | #272 | Tragic 12.8% |
| Pennsylvania Germans | 0.1 /100 | #273 | Tragic 12.8% |
| Celtics | 0.1 /100 | #274 | Tragic 12.9% |
Demographics Similar to Greeks by Disability Age 35 to 64
In terms of disability age 35 to 64, the demographic groups most similar to Greeks are Immigrants from Albania (10.7%, a difference of 0.050%), Immigrants (10.7%, a difference of 0.050%), Immigrants from Ecuador (10.7%, a difference of 0.050%), Salvadoran (10.7%, a difference of 0.11%), and Immigrants from El Salvador (10.7%, a difference of 0.16%).
| Demographics | Rating | Rank | Disability Age 35 to 64 |
| South Africans | 93.3 /100 | #128 | Exceptional 10.7% |
| Ecuadorians | 93.1 /100 | #129 | Exceptional 10.7% |
| Immigrants | Syria | 93.0 /100 | #130 | Exceptional 10.7% |
| Immigrants | El Salvador | 92.8 /100 | #131 | Exceptional 10.7% |
| Immigrants | Albania | 92.5 /100 | #132 | Exceptional 10.7% |
| Immigrants | Immigrants | 92.5 /100 | #133 | Exceptional 10.7% |
| Immigrants | Ecuador | 92.5 /100 | #134 | Exceptional 10.7% |
| Greeks | 92.3 /100 | #135 | Exceptional 10.7% |
| Salvadorans | 91.9 /100 | #136 | Exceptional 10.7% |
| Immigrants | Costa Rica | 91.7 /100 | #137 | Exceptional 10.7% |
| Immigrants | Southern Europe | 91.5 /100 | #138 | Exceptional 10.7% |
| Costa Ricans | 91.4 /100 | #139 | Exceptional 10.7% |
| Immigrants | Scotland | 91.3 /100 | #140 | Exceptional 10.7% |
| Australians | 90.7 /100 | #141 | Exceptional 10.8% |
| Immigrants | Saudi Arabia | 90.6 /100 | #142 | Exceptional 10.8% |