Subsaharan African vs Alaskan Athabascan Disability Age 35 to 64
COMPARE
Subsaharan African
Alaskan Athabascan
Disability Age 35 to 64
Disability Age 35 to 64 Comparison
Sub-Saharan Africans
Alaskan Athabascans
12.6%
DISABILITY AGE 35 TO 64
0.2/ 100
METRIC RATING
267th/ 347
METRIC RANK
15.7%
DISABILITY AGE 35 TO 64
0.0/ 100
METRIC RATING
332nd/ 347
METRIC RANK
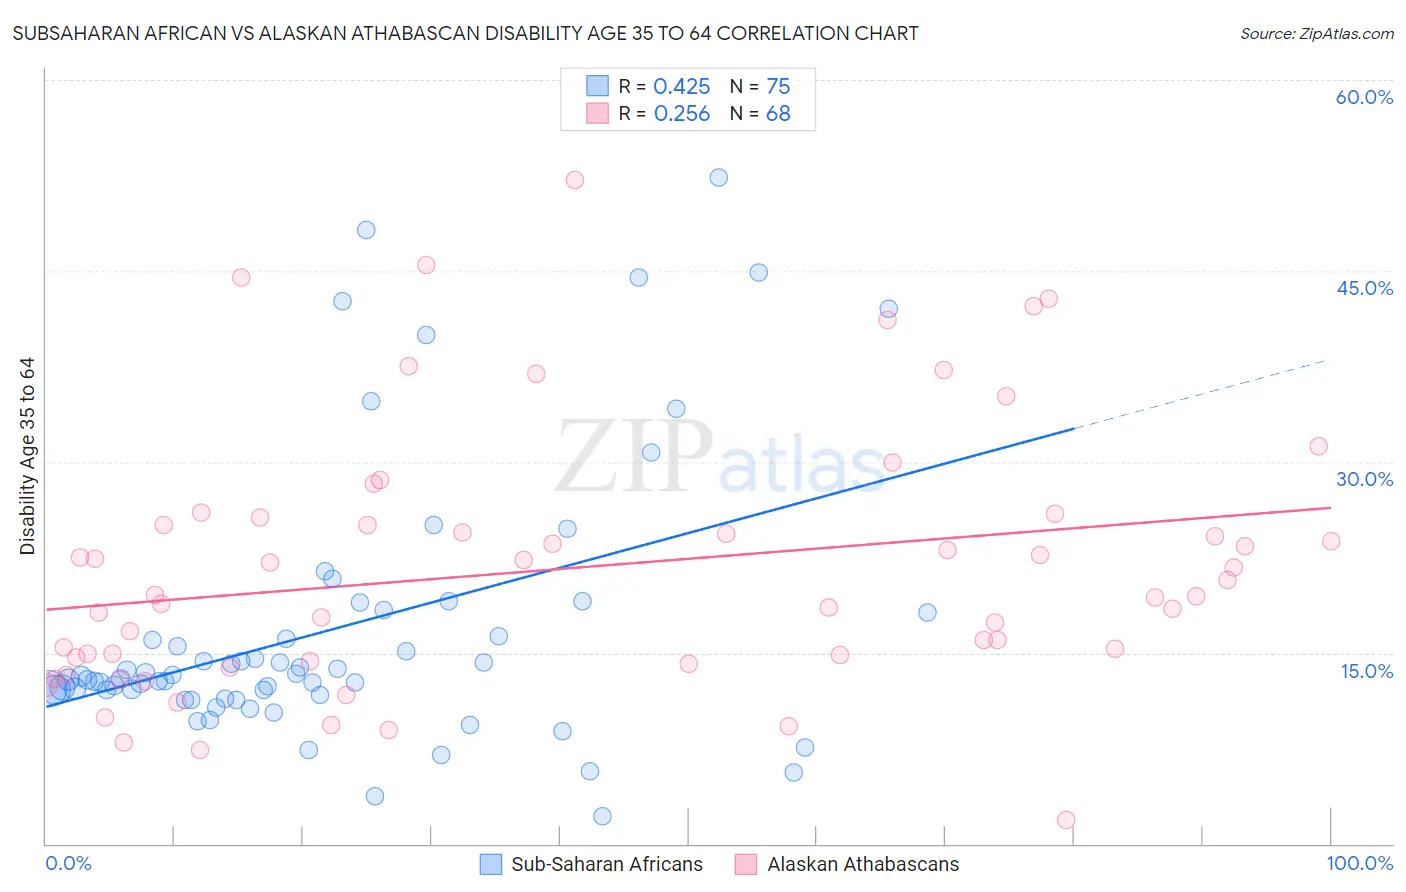
Subsaharan African vs Alaskan Athabascan Disability Age 35 to 64 Correlation Chart
The statistical analysis conducted on geographies consisting of 507,479,662 people shows a moderate positive correlation between the proportion of Sub-Saharan Africans and percentage of population with a disability between the ages 34 and 64 in the United States with a correlation coefficient (R) of 0.425 and weighted average of 12.6%. Similarly, the statistical analysis conducted on geographies consisting of 45,816,251 people shows a weak positive correlation between the proportion of Alaskan Athabascans and percentage of population with a disability between the ages 34 and 64 in the United States with a correlation coefficient (R) of 0.256 and weighted average of 15.7%, a difference of 24.4%.
Disability Age 35 to 64 Correlation Summary
| Measurement | Subsaharan African | Alaskan Athabascan |
| Minimum | 2.2% | 1.9% |
| Maximum | 52.4% | 52.2% |
| Range | 50.2% | 50.3% |
| Mean | 16.8% | 21.7% |
| Median | 12.9% | 19.5% |
| Interquartile 25% (IQ1) | 11.6% | 14.5% |
| Interquartile 75% (IQ3) | 18.2% | 25.4% |
| Interquartile Range (IQR) | 6.5% | 10.9% |
| Standard Deviation (Sample) | 10.7% | 10.3% |
| Standard Deviation (Population) | 10.7% | 10.3% |
Similar Demographics by Disability Age 35 to 64
Demographics Similar to Sub-Saharan Africans by Disability Age 35 to 64
In terms of disability age 35 to 64, the demographic groups most similar to Sub-Saharan Africans are White/Caucasian (12.6%, a difference of 0.16%), Immigrants from Dominica (12.7%, a difference of 0.18%), Spanish (12.7%, a difference of 0.28%), French (12.7%, a difference of 0.33%), and Marshallese (12.5%, a difference of 0.86%).
| Demographics | Rating | Rank | Disability Age 35 to 64 |
| German Russians | 0.5 /100 | #260 | Tragic 12.5% |
| Malaysians | 0.5 /100 | #261 | Tragic 12.5% |
| Senegalese | 0.5 /100 | #262 | Tragic 12.5% |
| Immigrants | Zaire | 0.4 /100 | #263 | Tragic 12.5% |
| Immigrants | Portugal | 0.4 /100 | #264 | Tragic 12.5% |
| Marshallese | 0.4 /100 | #265 | Tragic 12.5% |
| Whites/Caucasians | 0.3 /100 | #266 | Tragic 12.6% |
| Sub-Saharan Africans | 0.2 /100 | #267 | Tragic 12.6% |
| Immigrants | Dominica | 0.2 /100 | #268 | Tragic 12.7% |
| Spanish | 0.2 /100 | #269 | Tragic 12.7% |
| French | 0.2 /100 | #270 | Tragic 12.7% |
| Nepalese | 0.1 /100 | #271 | Tragic 12.8% |
| U.S. Virgin Islanders | 0.1 /100 | #272 | Tragic 12.8% |
| Pennsylvania Germans | 0.1 /100 | #273 | Tragic 12.8% |
| Celtics | 0.1 /100 | #274 | Tragic 12.9% |
Demographics Similar to Alaskan Athabascans by Disability Age 35 to 64
In terms of disability age 35 to 64, the demographic groups most similar to Alaskan Athabascans are Yuman (15.8%, a difference of 0.55%), Dutch West Indian (15.6%, a difference of 0.59%), Colville (15.8%, a difference of 0.75%), Seminole (15.9%, a difference of 0.85%), and Menominee (15.9%, a difference of 1.1%).
| Demographics | Rating | Rank | Disability Age 35 to 64 |
| Arapaho | 0.0 /100 | #325 | Tragic 15.1% |
| Natives/Alaskans | 0.0 /100 | #326 | Tragic 15.3% |
| Pueblo | 0.0 /100 | #327 | Tragic 15.3% |
| Cajuns | 0.0 /100 | #328 | Tragic 15.3% |
| Cherokee | 0.0 /100 | #329 | Tragic 15.5% |
| Navajo | 0.0 /100 | #330 | Tragic 15.5% |
| Dutch West Indians | 0.0 /100 | #331 | Tragic 15.6% |
| Alaskan Athabascans | 0.0 /100 | #332 | Tragic 15.7% |
| Yuman | 0.0 /100 | #333 | Tragic 15.8% |
| Colville | 0.0 /100 | #334 | Tragic 15.8% |
| Seminole | 0.0 /100 | #335 | Tragic 15.9% |
| Menominee | 0.0 /100 | #336 | Tragic 15.9% |
| Puerto Ricans | 0.0 /100 | #337 | Tragic 15.9% |
| Chickasaw | 0.0 /100 | #338 | Tragic 16.1% |
| Pima | 0.0 /100 | #339 | Tragic 16.1% |