Apache vs Tohono O'odham Disability Age 35 to 64
COMPARE
Apache
Tohono O'odham
Disability Age 35 to 64
Disability Age 35 to 64 Comparison
Apache
Tohono O'odham
14.9%
DISABILITY AGE 35 TO 64
0.0/ 100
METRIC RATING
323rd/ 347
METRIC RANK
16.7%
DISABILITY AGE 35 TO 64
0.0/ 100
METRIC RATING
342nd/ 347
METRIC RANK
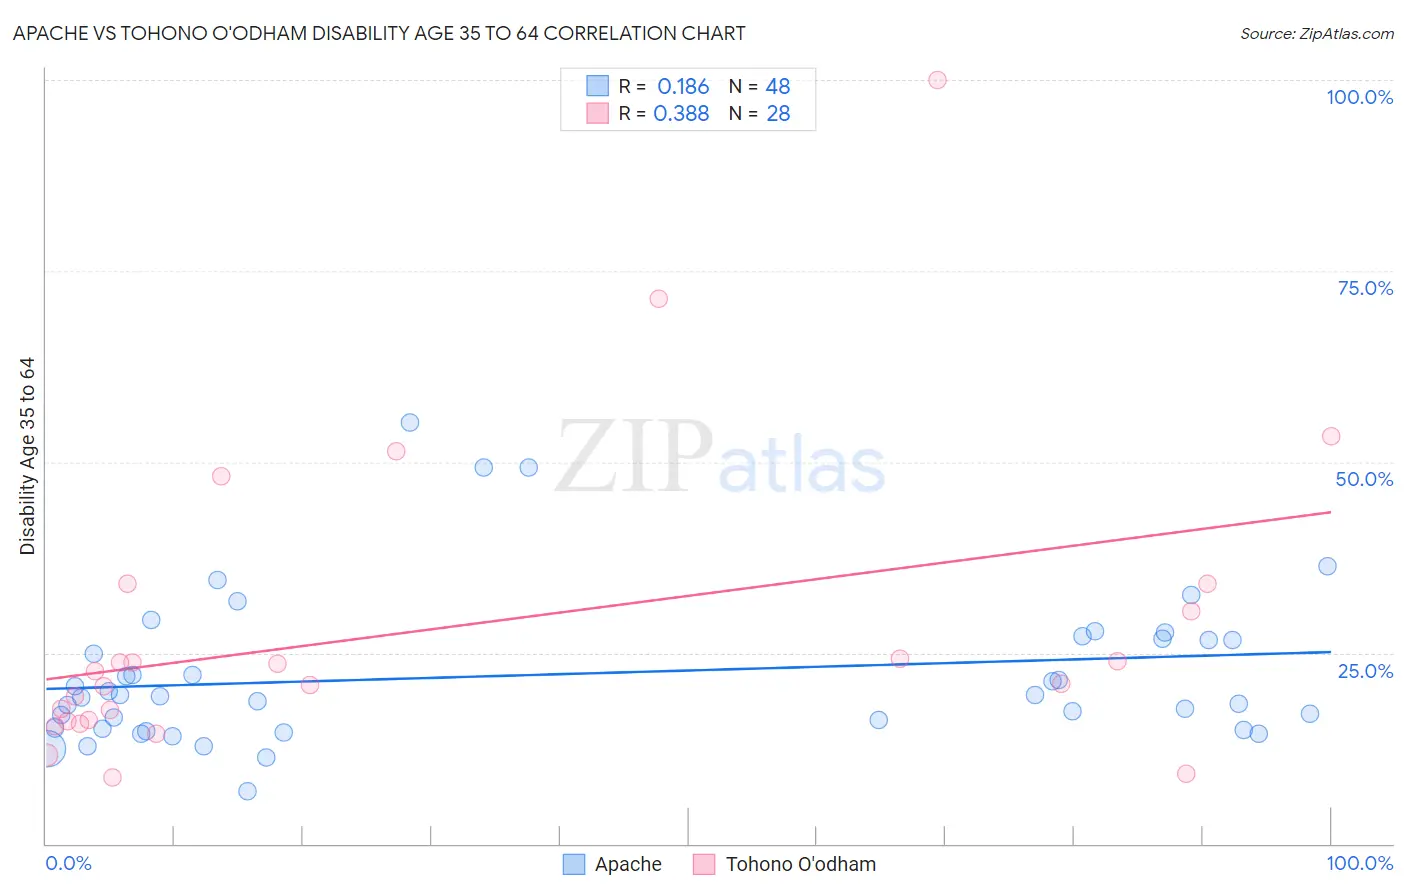
Apache vs Tohono O'odham Disability Age 35 to 64 Correlation Chart
The statistical analysis conducted on geographies consisting of 231,024,095 people shows a poor positive correlation between the proportion of Apache and percentage of population with a disability between the ages 34 and 64 in the United States with a correlation coefficient (R) of 0.186 and weighted average of 14.9%. Similarly, the statistical analysis conducted on geographies consisting of 58,717,576 people shows a mild positive correlation between the proportion of Tohono O'odham and percentage of population with a disability between the ages 34 and 64 in the United States with a correlation coefficient (R) of 0.388 and weighted average of 16.7%, a difference of 12.1%.
Disability Age 35 to 64 Correlation Summary
| Measurement | Apache | Tohono O'odham |
| Minimum | 6.9% | 8.7% |
| Maximum | 55.2% | 100.0% |
| Range | 48.3% | 91.3% |
| Mean | 22.1% | 28.2% |
| Median | 19.4% | 21.7% |
| Interquartile 25% (IQ1) | 15.1% | 16.2% |
| Interquartile 75% (IQ3) | 26.8% | 32.2% |
| Interquartile Range (IQR) | 11.7% | 16.0% |
| Standard Deviation (Sample) | 9.9% | 20.2% |
| Standard Deviation (Population) | 9.8% | 19.9% |
Demographics Similar to Apache and Tohono O'odham by Disability Age 35 to 64
In terms of disability age 35 to 64, the demographic groups most similar to Apache are Chippewa (15.0%, a difference of 0.20%), Arapaho (15.1%, a difference of 0.87%), Potawatomi (14.8%, a difference of 1.2%), Native/Alaskan (15.3%, a difference of 2.5%), and Pueblo (15.3%, a difference of 2.5%). Similarly, the demographic groups most similar to Tohono O'odham are Tsimshian (16.7%, a difference of 0.11%), Choctaw (16.4%, a difference of 2.0%), Pima (16.1%, a difference of 3.7%), Chickasaw (16.1%, a difference of 4.0%), and Puerto Rican (15.9%, a difference of 5.0%).
| Demographics | Rating | Rank | Disability Age 35 to 64 |
| Potawatomi | 0.0 /100 | #322 | Tragic 14.8% |
| Apache | 0.0 /100 | #323 | Tragic 14.9% |
| Chippewa | 0.0 /100 | #324 | Tragic 15.0% |
| Arapaho | 0.0 /100 | #325 | Tragic 15.1% |
| Natives/Alaskans | 0.0 /100 | #326 | Tragic 15.3% |
| Pueblo | 0.0 /100 | #327 | Tragic 15.3% |
| Cajuns | 0.0 /100 | #328 | Tragic 15.3% |
| Cherokee | 0.0 /100 | #329 | Tragic 15.5% |
| Navajo | 0.0 /100 | #330 | Tragic 15.5% |
| Dutch West Indians | 0.0 /100 | #331 | Tragic 15.6% |
| Alaskan Athabascans | 0.0 /100 | #332 | Tragic 15.7% |
| Yuman | 0.0 /100 | #333 | Tragic 15.8% |
| Colville | 0.0 /100 | #334 | Tragic 15.8% |
| Seminole | 0.0 /100 | #335 | Tragic 15.9% |
| Menominee | 0.0 /100 | #336 | Tragic 15.9% |
| Puerto Ricans | 0.0 /100 | #337 | Tragic 15.9% |
| Chickasaw | 0.0 /100 | #338 | Tragic 16.1% |
| Pima | 0.0 /100 | #339 | Tragic 16.1% |
| Choctaw | 0.0 /100 | #340 | Tragic 16.4% |
| Tsimshian | 0.0 /100 | #341 | Tragic 16.7% |
| Tohono O'odham | 0.0 /100 | #342 | Tragic 16.7% |