Spanish American Indian vs Osage Self-Care Disability
COMPARE
Spanish American Indian
Osage
Self-Care Disability
Self-Care Disability Comparison
Spanish American Indians
Osage
2.9%
SELF-CARE DISABILITY
0.0/ 100
METRIC RATING
319th/ 347
METRIC RANK
2.6%
SELF-CARE DISABILITY
3.6/ 100
METRIC RATING
224th/ 347
METRIC RANK
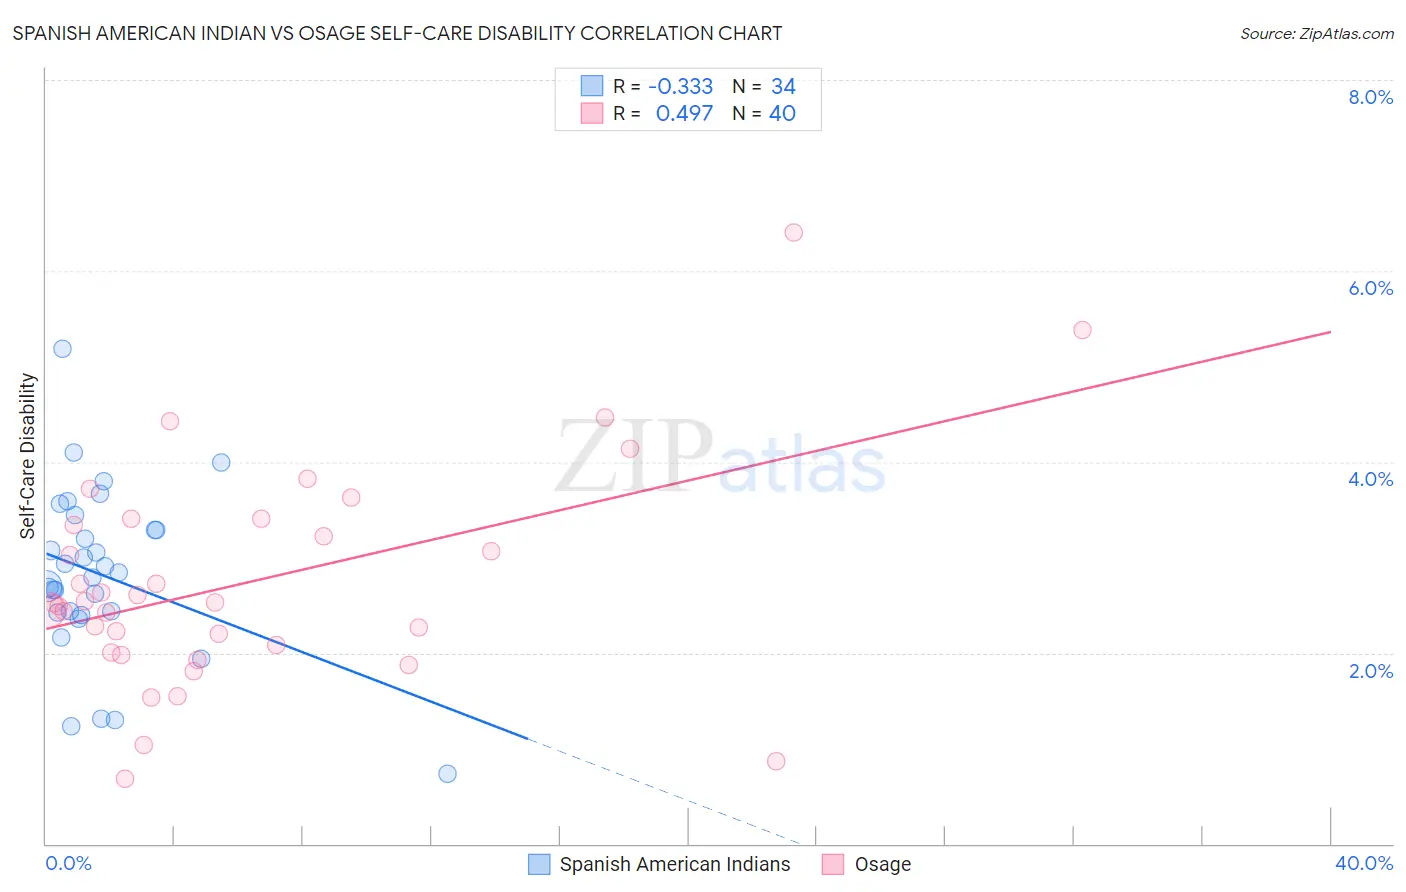
Spanish American Indian vs Osage Self-Care Disability Correlation Chart
The statistical analysis conducted on geographies consisting of 73,138,430 people shows a mild negative correlation between the proportion of Spanish American Indians and percentage of population with self-care disability in the United States with a correlation coefficient (R) of -0.333 and weighted average of 2.9%. Similarly, the statistical analysis conducted on geographies consisting of 91,779,212 people shows a moderate positive correlation between the proportion of Osage and percentage of population with self-care disability in the United States with a correlation coefficient (R) of 0.497 and weighted average of 2.6%, a difference of 11.3%.
Self-Care Disability Correlation Summary
| Measurement | Spanish American Indian | Osage |
| Minimum | 0.73% | 0.68% |
| Maximum | 5.2% | 6.4% |
| Range | 4.4% | 5.7% |
| Mean | 2.8% | 2.7% |
| Median | 2.8% | 2.5% |
| Interquartile 25% (IQ1) | 2.4% | 2.0% |
| Interquartile 75% (IQ3) | 3.3% | 3.4% |
| Interquartile Range (IQR) | 0.86% | 1.3% |
| Standard Deviation (Sample) | 0.89% | 1.2% |
| Standard Deviation (Population) | 0.88% | 1.1% |
Similar Demographics by Self-Care Disability
Demographics Similar to Spanish American Indians by Self-Care Disability
In terms of self-care disability, the demographic groups most similar to Spanish American Indians are Assyrian/Chaldean/Syriac (2.8%, a difference of 0.16%), Immigrants from Dominica (2.8%, a difference of 0.17%), Chickasaw (2.9%, a difference of 0.22%), Menominee (2.8%, a difference of 0.29%), and Navajo (2.9%, a difference of 0.37%).
| Demographics | Rating | Rank | Self-Care Disability |
| Immigrants | Caribbean | 0.0 /100 | #312 | Tragic 2.8% |
| Spanish Americans | 0.0 /100 | #313 | Tragic 2.8% |
| Creek | 0.0 /100 | #314 | Tragic 2.8% |
| Immigrants | Cuba | 0.0 /100 | #315 | Tragic 2.8% |
| Menominee | 0.0 /100 | #316 | Tragic 2.8% |
| Immigrants | Dominica | 0.0 /100 | #317 | Tragic 2.8% |
| Assyrians/Chaldeans/Syriacs | 0.0 /100 | #318 | Tragic 2.8% |
| Spanish American Indians | 0.0 /100 | #319 | Tragic 2.9% |
| Chickasaw | 0.0 /100 | #320 | Tragic 2.9% |
| Navajo | 0.0 /100 | #321 | Tragic 2.9% |
| Comanche | 0.0 /100 | #322 | Tragic 2.9% |
| Seminole | 0.0 /100 | #323 | Tragic 2.9% |
| Cherokee | 0.0 /100 | #324 | Tragic 2.9% |
| Immigrants | Uzbekistan | 0.0 /100 | #325 | Tragic 2.9% |
| Paiute | 0.0 /100 | #326 | Tragic 2.9% |
Demographics Similar to Osage by Self-Care Disability
In terms of self-care disability, the demographic groups most similar to Osage are French Canadian (2.6%, a difference of 0.050%), Spaniard (2.6%, a difference of 0.060%), Honduran (2.6%, a difference of 0.070%), Subsaharan African (2.6%, a difference of 0.11%), and Immigrants from Moldova (2.6%, a difference of 0.12%).
| Demographics | Rating | Rank | Self-Care Disability |
| Celtics | 4.4 /100 | #217 | Tragic 2.6% |
| Scotch-Irish | 4.1 /100 | #218 | Tragic 2.6% |
| Immigrants | Moldova | 4.0 /100 | #219 | Tragic 2.6% |
| Sub-Saharan Africans | 4.0 /100 | #220 | Tragic 2.6% |
| Hondurans | 3.8 /100 | #221 | Tragic 2.6% |
| Spaniards | 3.8 /100 | #222 | Tragic 2.6% |
| French Canadians | 3.8 /100 | #223 | Tragic 2.6% |
| Osage | 3.6 /100 | #224 | Tragic 2.6% |
| Iraqis | 3.2 /100 | #225 | Tragic 2.6% |
| Chinese | 2.9 /100 | #226 | Tragic 2.6% |
| Immigrants | Philippines | 2.7 /100 | #227 | Tragic 2.6% |
| Guatemalans | 2.7 /100 | #228 | Tragic 2.6% |
| Guamanians/Chamorros | 2.5 /100 | #229 | Tragic 2.6% |
| Immigrants | Ecuador | 2.5 /100 | #230 | Tragic 2.6% |
| Immigrants | Guatemala | 2.2 /100 | #231 | Tragic 2.6% |