Somali vs Honduran Self-Care Disability
COMPARE
Somali
Honduran
Self-Care Disability
Self-Care Disability Comparison
Somalis
Hondurans
2.5%
SELF-CARE DISABILITY
63.7/ 100
METRIC RATING
162nd/ 347
METRIC RANK
2.6%
SELF-CARE DISABILITY
3.8/ 100
METRIC RATING
221st/ 347
METRIC RANK
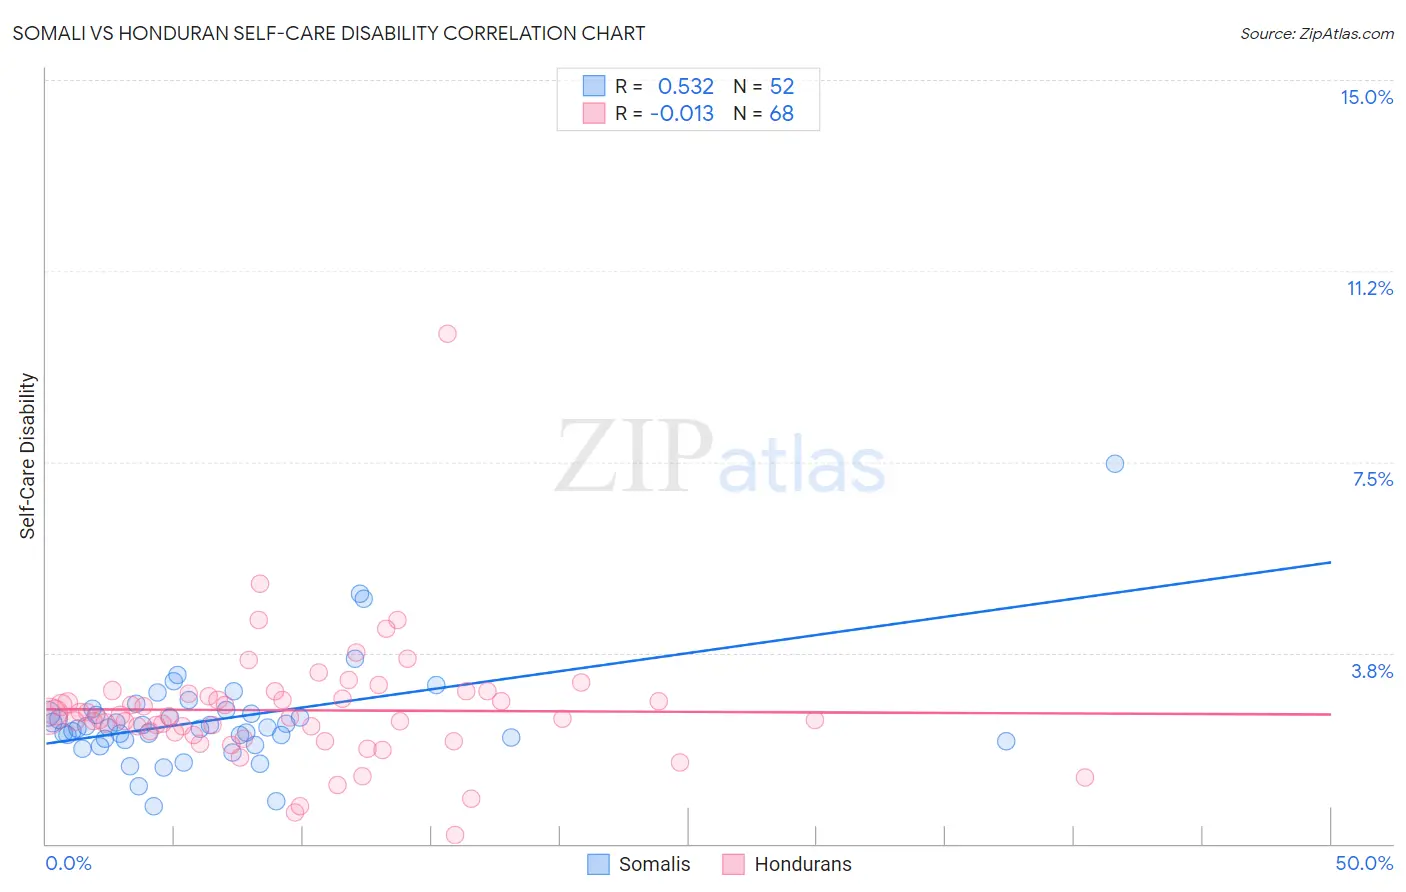
Somali vs Honduran Self-Care Disability Correlation Chart
The statistical analysis conducted on geographies consisting of 99,258,512 people shows a substantial positive correlation between the proportion of Somalis and percentage of population with self-care disability in the United States with a correlation coefficient (R) of 0.532 and weighted average of 2.5%. Similarly, the statistical analysis conducted on geographies consisting of 357,432,362 people shows no correlation between the proportion of Hondurans and percentage of population with self-care disability in the United States with a correlation coefficient (R) of -0.013 and weighted average of 2.6%, a difference of 4.5%.
Self-Care Disability Correlation Summary
| Measurement | Somali | Honduran |
| Minimum | 0.74% | 0.18% |
| Maximum | 7.5% | 10.0% |
| Range | 6.7% | 9.9% |
| Mean | 2.4% | 2.6% |
| Median | 2.3% | 2.5% |
| Interquartile 25% (IQ1) | 2.0% | 2.2% |
| Interquartile 75% (IQ3) | 2.6% | 2.9% |
| Interquartile Range (IQR) | 0.54% | 0.75% |
| Standard Deviation (Sample) | 1.0% | 1.2% |
| Standard Deviation (Population) | 1.0% | 1.2% |
Similar Demographics by Self-Care Disability
Demographics Similar to Somalis by Self-Care Disability
In terms of self-care disability, the demographic groups most similar to Somalis are German Russian (2.5%, a difference of 0.050%), Lebanese (2.4%, a difference of 0.14%), Finnish (2.4%, a difference of 0.17%), Immigrants from Vietnam (2.5%, a difference of 0.23%), and Syrian (2.5%, a difference of 0.24%).
| Demographics | Rating | Rank | Self-Care Disability |
| Pakistanis | 71.4 /100 | #155 | Good 2.4% |
| Nigerians | 70.6 /100 | #156 | Good 2.4% |
| Immigrants | Europe | 69.6 /100 | #157 | Good 2.4% |
| Immigrants | Western Europe | 68.6 /100 | #158 | Good 2.4% |
| Immigrants | Italy | 68.5 /100 | #159 | Good 2.4% |
| Finns | 67.0 /100 | #160 | Good 2.4% |
| Lebanese | 66.5 /100 | #161 | Good 2.4% |
| Somalis | 63.7 /100 | #162 | Good 2.5% |
| German Russians | 62.7 /100 | #163 | Good 2.5% |
| Immigrants | Vietnam | 59.3 /100 | #164 | Average 2.5% |
| Syrians | 59.0 /100 | #165 | Average 2.5% |
| Canadians | 58.8 /100 | #166 | Average 2.5% |
| Immigrants | Greece | 57.3 /100 | #167 | Average 2.5% |
| Ute | 57.1 /100 | #168 | Average 2.5% |
| Immigrants | Somalia | 55.9 /100 | #169 | Average 2.5% |
Demographics Similar to Hondurans by Self-Care Disability
In terms of self-care disability, the demographic groups most similar to Hondurans are Spaniard (2.6%, a difference of 0.010%), French Canadian (2.6%, a difference of 0.020%), Subsaharan African (2.6%, a difference of 0.040%), Immigrants from Moldova (2.6%, a difference of 0.050%), and Osage (2.6%, a difference of 0.070%).
| Demographics | Rating | Rank | Self-Care Disability |
| Immigrants | Honduras | 4.7 /100 | #214 | Tragic 2.6% |
| Immigrants | Thailand | 4.5 /100 | #215 | Tragic 2.6% |
| Whites/Caucasians | 4.4 /100 | #216 | Tragic 2.6% |
| Celtics | 4.4 /100 | #217 | Tragic 2.6% |
| Scotch-Irish | 4.1 /100 | #218 | Tragic 2.6% |
| Immigrants | Moldova | 4.0 /100 | #219 | Tragic 2.6% |
| Sub-Saharan Africans | 4.0 /100 | #220 | Tragic 2.6% |
| Hondurans | 3.8 /100 | #221 | Tragic 2.6% |
| Spaniards | 3.8 /100 | #222 | Tragic 2.6% |
| French Canadians | 3.8 /100 | #223 | Tragic 2.6% |
| Osage | 3.6 /100 | #224 | Tragic 2.6% |
| Iraqis | 3.2 /100 | #225 | Tragic 2.6% |
| Chinese | 2.9 /100 | #226 | Tragic 2.6% |
| Immigrants | Philippines | 2.7 /100 | #227 | Tragic 2.6% |
| Guatemalans | 2.7 /100 | #228 | Tragic 2.6% |