Somali vs German Self-Care Disability
COMPARE
Somali
German
Self-Care Disability
Self-Care Disability Comparison
Somalis
Germans
2.5%
SELF-CARE DISABILITY
63.7/ 100
METRIC RATING
162nd/ 347
METRIC RANK
2.4%
SELF-CARE DISABILITY
80.1/ 100
METRIC RATING
145th/ 347
METRIC RANK
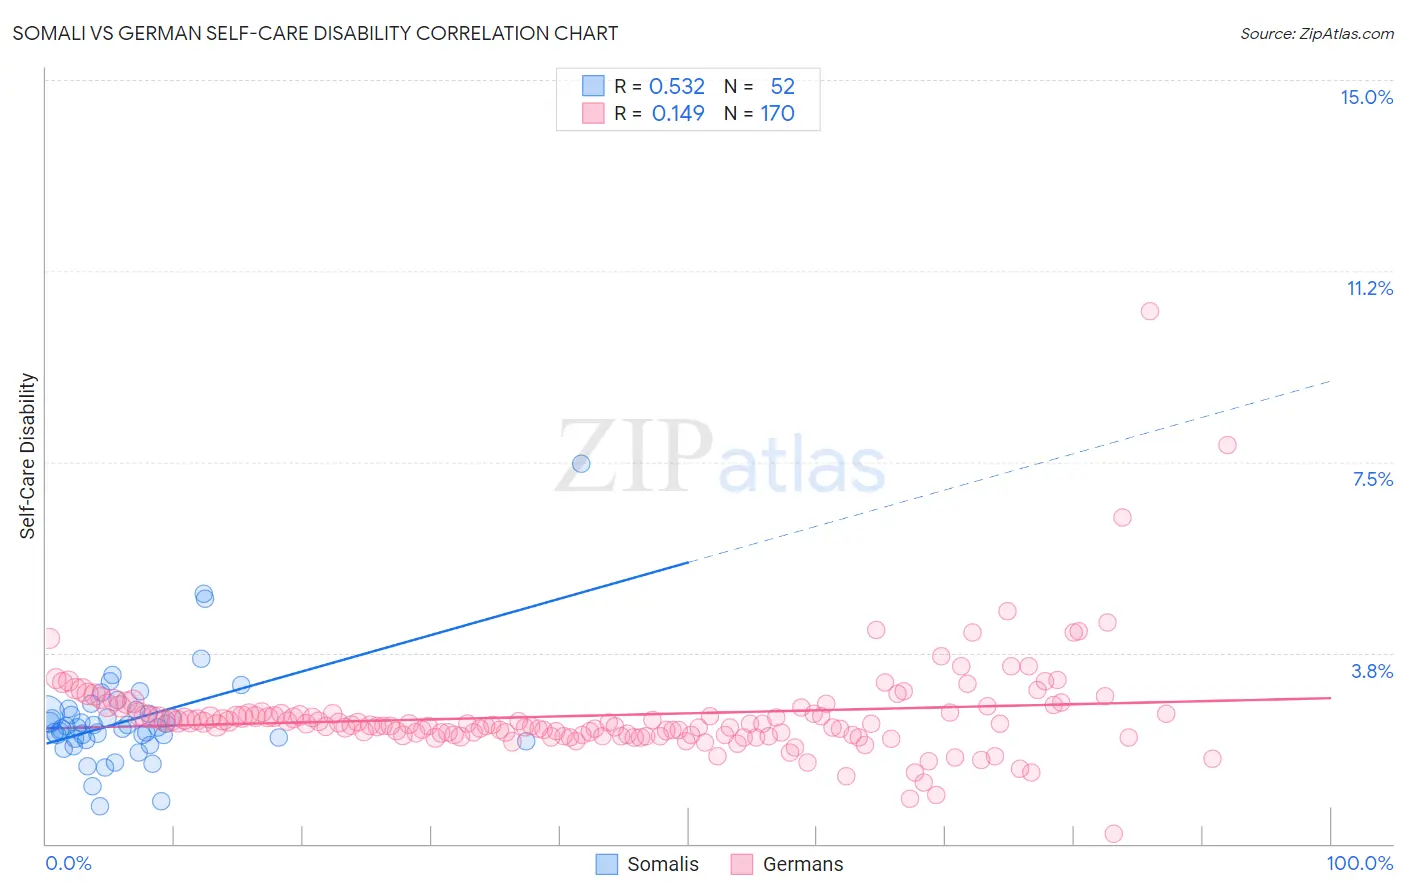
Somali vs German Self-Care Disability Correlation Chart
The statistical analysis conducted on geographies consisting of 99,258,512 people shows a substantial positive correlation between the proportion of Somalis and percentage of population with self-care disability in the United States with a correlation coefficient (R) of 0.532 and weighted average of 2.5%. Similarly, the statistical analysis conducted on geographies consisting of 577,887,813 people shows a poor positive correlation between the proportion of Germans and percentage of population with self-care disability in the United States with a correlation coefficient (R) of 0.149 and weighted average of 2.4%, a difference of 1.0%.
Self-Care Disability Correlation Summary
| Measurement | Somali | German |
| Minimum | 0.74% | 0.20% |
| Maximum | 7.5% | 10.5% |
| Range | 6.7% | 10.3% |
| Mean | 2.4% | 2.5% |
| Median | 2.3% | 2.3% |
| Interquartile 25% (IQ1) | 2.0% | 2.1% |
| Interquartile 75% (IQ3) | 2.6% | 2.6% |
| Interquartile Range (IQR) | 0.54% | 0.42% |
| Standard Deviation (Sample) | 1.0% | 1.00% |
| Standard Deviation (Population) | 1.0% | 1.00% |
Demographics Similar to Somalis and Germans by Self-Care Disability
In terms of self-care disability, the demographic groups most similar to Somalis are German Russian (2.5%, a difference of 0.050%), Lebanese (2.4%, a difference of 0.14%), Finnish (2.4%, a difference of 0.17%), Immigrants from Western Europe (2.4%, a difference of 0.26%), and Immigrants from Italy (2.4%, a difference of 0.26%). Similarly, the demographic groups most similar to Germans are Israeli (2.4%, a difference of 0.010%), Costa Rican (2.4%, a difference of 0.050%), Afghan (2.4%, a difference of 0.17%), Dutch (2.4%, a difference of 0.19%), and Romanian (2.4%, a difference of 0.30%).
| Demographics | Rating | Rank | Self-Care Disability |
| Afghans | 82.3 /100 | #143 | Excellent 2.4% |
| Costa Ricans | 80.8 /100 | #144 | Excellent 2.4% |
| Germans | 80.1 /100 | #145 | Excellent 2.4% |
| Israelis | 80.0 /100 | #146 | Good 2.4% |
| Dutch | 77.5 /100 | #147 | Good 2.4% |
| Romanians | 75.8 /100 | #148 | Good 2.4% |
| Arabs | 75.7 /100 | #149 | Good 2.4% |
| Immigrants | Costa Rica | 75.1 /100 | #150 | Good 2.4% |
| Basques | 74.0 /100 | #151 | Good 2.4% |
| Tlingit-Haida | 73.5 /100 | #152 | Good 2.4% |
| Immigrants | England | 73.5 /100 | #153 | Good 2.4% |
| Italians | 72.2 /100 | #154 | Good 2.4% |
| Pakistanis | 71.4 /100 | #155 | Good 2.4% |
| Nigerians | 70.6 /100 | #156 | Good 2.4% |
| Immigrants | Europe | 69.6 /100 | #157 | Good 2.4% |
| Immigrants | Western Europe | 68.6 /100 | #158 | Good 2.4% |
| Immigrants | Italy | 68.5 /100 | #159 | Good 2.4% |
| Finns | 67.0 /100 | #160 | Good 2.4% |
| Lebanese | 66.5 /100 | #161 | Good 2.4% |
| Somalis | 63.7 /100 | #162 | Good 2.5% |
| German Russians | 62.7 /100 | #163 | Good 2.5% |