Slovak vs Indonesian Self-Care Disability
COMPARE
Slovak
Indonesian
Self-Care Disability
Self-Care Disability Comparison
Slovaks
Indonesians
2.5%
SELF-CARE DISABILITY
12.6/ 100
METRIC RATING
202nd/ 347
METRIC RANK
2.5%
SELF-CARE DISABILITY
41.2/ 100
METRIC RATING
180th/ 347
METRIC RANK
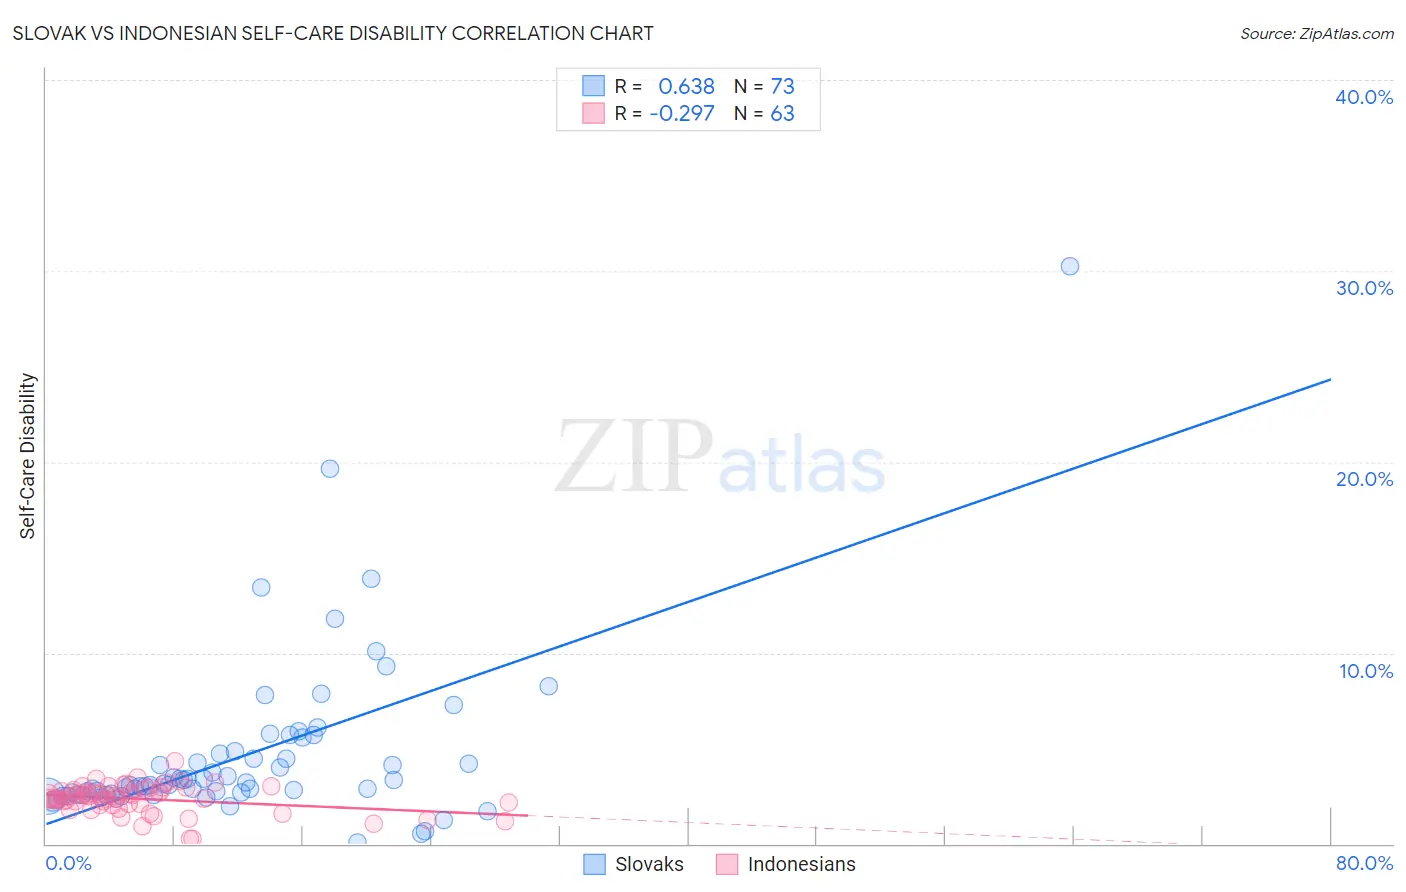
Slovak vs Indonesian Self-Care Disability Correlation Chart
The statistical analysis conducted on geographies consisting of 397,370,448 people shows a significant positive correlation between the proportion of Slovaks and percentage of population with self-care disability in the United States with a correlation coefficient (R) of 0.638 and weighted average of 2.5%. Similarly, the statistical analysis conducted on geographies consisting of 162,620,981 people shows a weak negative correlation between the proportion of Indonesians and percentage of population with self-care disability in the United States with a correlation coefficient (R) of -0.297 and weighted average of 2.5%, a difference of 1.9%.
Self-Care Disability Correlation Summary
| Measurement | Slovak | Indonesian |
| Minimum | 0.091% | 0.26% |
| Maximum | 30.2% | 4.4% |
| Range | 30.1% | 4.1% |
| Mean | 4.6% | 2.3% |
| Median | 3.1% | 2.5% |
| Interquartile 25% (IQ1) | 2.6% | 2.1% |
| Interquartile 75% (IQ3) | 4.8% | 2.8% |
| Interquartile Range (IQR) | 2.2% | 0.79% |
| Standard Deviation (Sample) | 4.4% | 0.74% |
| Standard Deviation (Population) | 4.4% | 0.74% |
Similar Demographics by Self-Care Disability
Demographics Similar to Slovaks by Self-Care Disability
In terms of self-care disability, the demographic groups most similar to Slovaks are Immigrants from Lebanon (2.5%, a difference of 0.020%), Immigrants from South Eastern Asia (2.5%, a difference of 0.030%), Immigrants from Western Africa (2.5%, a difference of 0.070%), Immigrants from Bahamas (2.5%, a difference of 0.080%), and Immigrants from Russia (2.5%, a difference of 0.18%).
| Demographics | Rating | Rank | Self-Care Disability |
| Immigrants | Southern Europe | 15.6 /100 | #195 | Poor 2.5% |
| Koreans | 15.5 /100 | #196 | Poor 2.5% |
| Crow | 15.2 /100 | #197 | Poor 2.5% |
| Immigrants | Immigrants | 15.0 /100 | #198 | Poor 2.5% |
| Immigrants | Ghana | 14.7 /100 | #199 | Poor 2.5% |
| Immigrants | Western Africa | 13.3 /100 | #200 | Poor 2.5% |
| Immigrants | South Eastern Asia | 12.9 /100 | #201 | Poor 2.5% |
| Slovaks | 12.6 /100 | #202 | Poor 2.5% |
| Immigrants | Lebanon | 12.4 /100 | #203 | Poor 2.5% |
| Immigrants | Bahamas | 11.9 /100 | #204 | Poor 2.5% |
| Immigrants | Russia | 11.0 /100 | #205 | Poor 2.5% |
| Alaskan Athabascans | 10.4 /100 | #206 | Poor 2.5% |
| French | 9.9 /100 | #207 | Tragic 2.5% |
| Central Americans | 8.7 /100 | #208 | Tragic 2.5% |
| Malaysians | 7.7 /100 | #209 | Tragic 2.5% |
Demographics Similar to Indonesians by Self-Care Disability
In terms of self-care disability, the demographic groups most similar to Indonesians are Ghanaian (2.5%, a difference of 0.040%), Maltese (2.5%, a difference of 0.19%), Hungarian (2.5%, a difference of 0.21%), English (2.5%, a difference of 0.24%), and Salvadoran (2.5%, a difference of 0.24%).
| Demographics | Rating | Rank | Self-Care Disability |
| Immigrants | Burma/Myanmar | 52.8 /100 | #173 | Average 2.5% |
| Welsh | 50.0 /100 | #174 | Average 2.5% |
| Immigrants | Bosnia and Herzegovina | 49.6 /100 | #175 | Average 2.5% |
| Immigrants | Afghanistan | 47.6 /100 | #176 | Average 2.5% |
| Immigrants | Kazakhstan | 46.7 /100 | #177 | Average 2.5% |
| English | 46.2 /100 | #178 | Average 2.5% |
| Hungarians | 45.5 /100 | #179 | Average 2.5% |
| Indonesians | 41.2 /100 | #180 | Average 2.5% |
| Ghanaians | 40.4 /100 | #181 | Average 2.5% |
| Maltese | 37.5 /100 | #182 | Fair 2.5% |
| Salvadorans | 36.4 /100 | #183 | Fair 2.5% |
| Yugoslavians | 36.1 /100 | #184 | Fair 2.5% |
| Slavs | 34.3 /100 | #185 | Fair 2.5% |
| Immigrants | El Salvador | 33.0 /100 | #186 | Fair 2.5% |
| Irish | 28.7 /100 | #187 | Fair 2.5% |