Eastern European vs Immigrants from Somalia Disability
COMPARE
Eastern European
Immigrants from Somalia
Disability
Disability Comparison
Eastern Europeans
Immigrants from Somalia
11.2%
DISABILITY
97.8/ 100
METRIC RATING
95th/ 347
METRIC RANK
12.0%
DISABILITY
6.8/ 100
METRIC RATING
214th/ 347
METRIC RANK
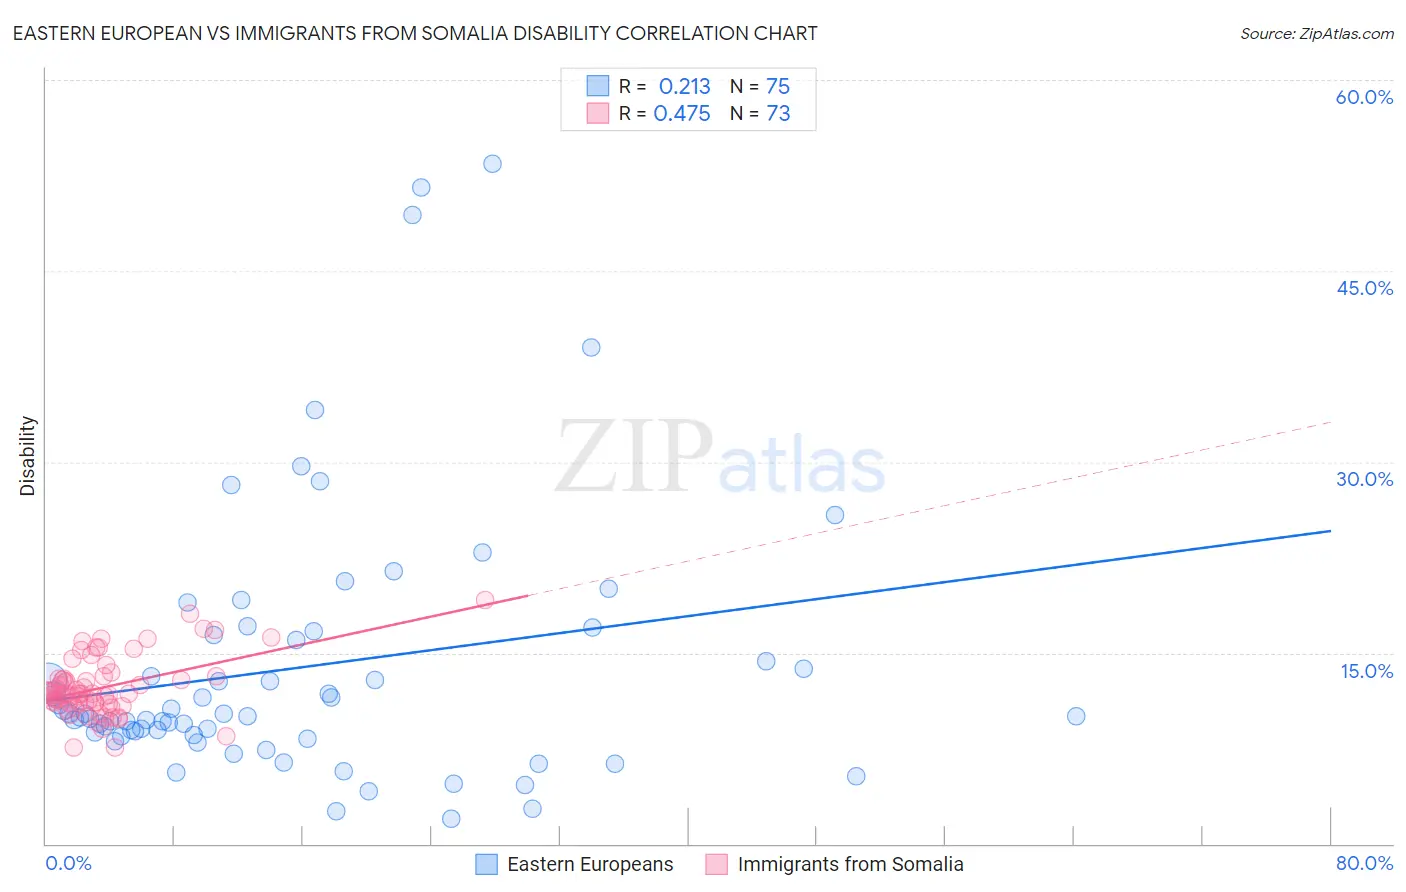
Eastern European vs Immigrants from Somalia Disability Correlation Chart
The statistical analysis conducted on geographies consisting of 461,211,417 people shows a weak positive correlation between the proportion of Eastern Europeans and percentage of population with a disability in the United States with a correlation coefficient (R) of 0.213 and weighted average of 11.2%. Similarly, the statistical analysis conducted on geographies consisting of 92,105,363 people shows a moderate positive correlation between the proportion of Immigrants from Somalia and percentage of population with a disability in the United States with a correlation coefficient (R) of 0.475 and weighted average of 12.0%, a difference of 7.4%.
Disability Correlation Summary
| Measurement | Eastern European | Immigrants from Somalia |
| Minimum | 2.0% | 7.5% |
| Maximum | 53.4% | 19.1% |
| Range | 51.5% | 11.6% |
| Mean | 13.9% | 12.3% |
| Median | 10.0% | 11.8% |
| Interquartile 25% (IQ1) | 8.6% | 11.1% |
| Interquartile 75% (IQ3) | 16.4% | 13.1% |
| Interquartile Range (IQR) | 7.9% | 2.0% |
| Standard Deviation (Sample) | 10.5% | 2.3% |
| Standard Deviation (Population) | 10.4% | 2.3% |
Similar Demographics by Disability
Demographics Similar to Eastern Europeans by Disability
In terms of disability, the demographic groups most similar to Eastern Europeans are Immigrants from Morocco (11.2%, a difference of 0.010%), Immigrants from Zimbabwe (11.2%, a difference of 0.060%), Immigrants from Ecuador (11.2%, a difference of 0.12%), Ecuadorian (11.2%, a difference of 0.13%), and Immigrants from Western Asia (11.2%, a difference of 0.16%).
| Demographics | Rating | Rank | Disability |
| Immigrants | Romania | 98.5 /100 | #88 | Exceptional 11.2% |
| Immigrants | South Africa | 98.2 /100 | #89 | Exceptional 11.2% |
| Immigrants | Brazil | 98.1 /100 | #90 | Exceptional 11.2% |
| Immigrants | Western Asia | 98.1 /100 | #91 | Exceptional 11.2% |
| Ecuadorians | 98.0 /100 | #92 | Exceptional 11.2% |
| Immigrants | Ecuador | 98.0 /100 | #93 | Exceptional 11.2% |
| Immigrants | Morocco | 97.8 /100 | #94 | Exceptional 11.2% |
| Eastern Europeans | 97.8 /100 | #95 | Exceptional 11.2% |
| Immigrants | Zimbabwe | 97.7 /100 | #96 | Exceptional 11.2% |
| Bhutanese | 97.4 /100 | #97 | Exceptional 11.2% |
| Uruguayans | 97.4 /100 | #98 | Exceptional 11.2% |
| Immigrants | Czechoslovakia | 97.4 /100 | #99 | Exceptional 11.2% |
| Immigrants | Greece | 96.9 /100 | #100 | Exceptional 11.3% |
| Immigrants | Nicaragua | 96.8 /100 | #101 | Exceptional 11.3% |
| Immigrants | Eastern Africa | 96.7 /100 | #102 | Exceptional 11.3% |
Demographics Similar to Immigrants from Somalia by Disability
In terms of disability, the demographic groups most similar to Immigrants from Somalia are Immigrants from Iraq (12.0%, a difference of 0.050%), Austrian (12.0%, a difference of 0.060%), Immigrants from Cambodia (12.0%, a difference of 0.080%), Immigrants from Canada (12.1%, a difference of 0.13%), and Czech (12.0%, a difference of 0.16%).
| Demographics | Rating | Rank | Disability |
| Immigrants | Thailand | 9.3 /100 | #207 | Tragic 12.0% |
| Immigrants | Caribbean | 9.1 /100 | #208 | Tragic 12.0% |
| Danes | 8.7 /100 | #209 | Tragic 12.0% |
| Czechs | 7.9 /100 | #210 | Tragic 12.0% |
| Immigrants | Cambodia | 7.3 /100 | #211 | Tragic 12.0% |
| Austrians | 7.2 /100 | #212 | Tragic 12.0% |
| Immigrants | Iraq | 7.1 /100 | #213 | Tragic 12.0% |
| Immigrants | Somalia | 6.8 /100 | #214 | Tragic 12.0% |
| Immigrants | Canada | 6.1 /100 | #215 | Tragic 12.1% |
| Panamanians | 5.4 /100 | #216 | Tragic 12.1% |
| Immigrants | North America | 5.3 /100 | #217 | Tragic 12.1% |
| Immigrants | Jamaica | 5.0 /100 | #218 | Tragic 12.1% |
| Croatians | 4.9 /100 | #219 | Tragic 12.1% |
| Immigrants | Bahamas | 4.7 /100 | #220 | Tragic 12.1% |
| Northern Europeans | 4.2 /100 | #221 | Tragic 12.1% |