Portuguese vs Immigrants from Spain Female Disability
COMPARE
Portuguese
Immigrants from Spain
Female Disability
Female Disability Comparison
Portuguese
Immigrants from Spain
13.0%
FEMALE DISABILITY
0.1/ 100
METRIC RATING
274th/ 347
METRIC RANK
11.4%
FEMALE DISABILITY
99.9/ 100
METRIC RATING
59th/ 347
METRIC RANK
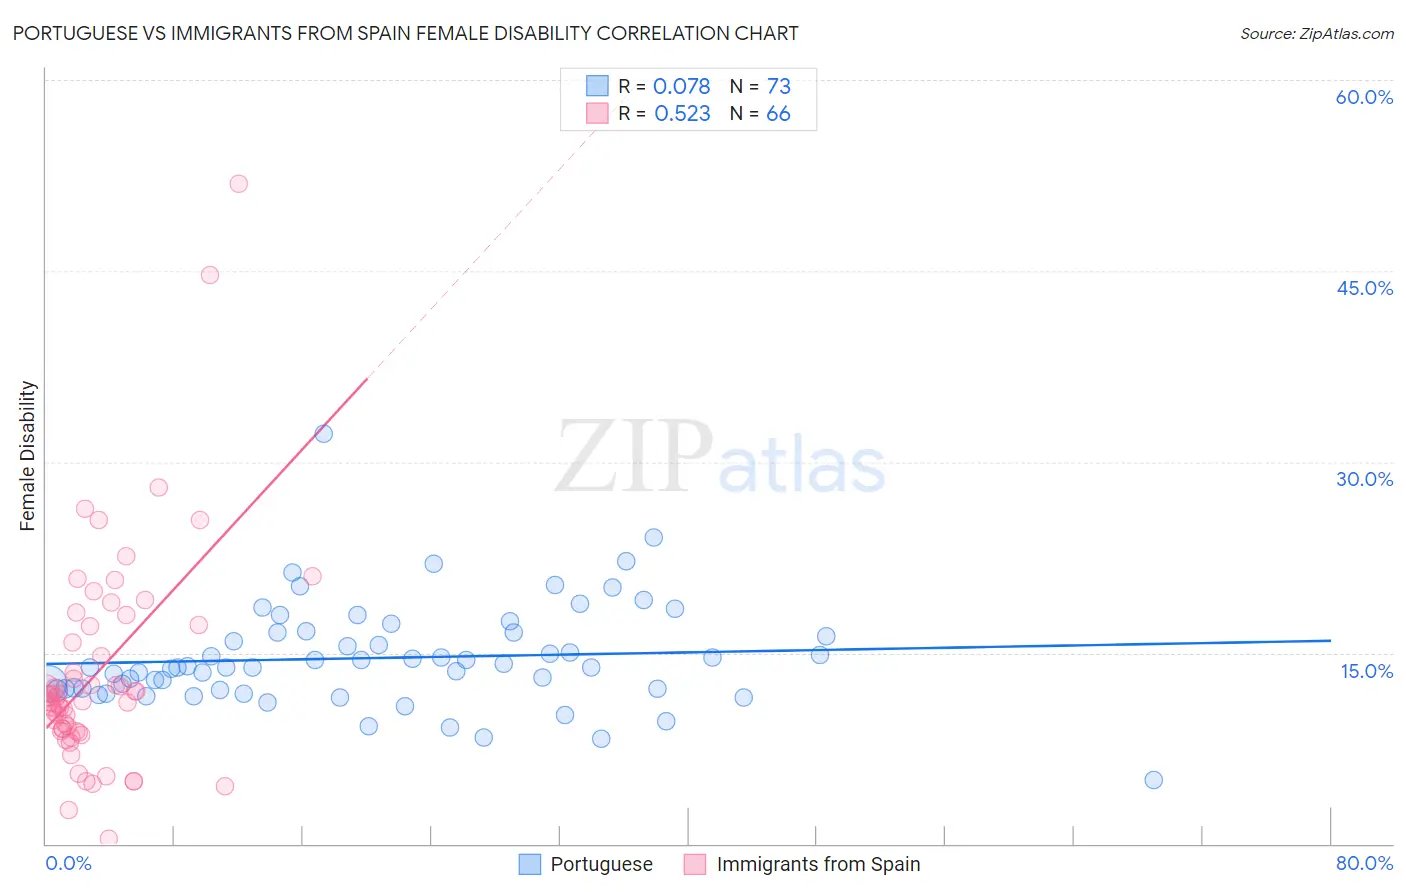
Portuguese vs Immigrants from Spain Female Disability Correlation Chart
The statistical analysis conducted on geographies consisting of 450,255,075 people shows a slight positive correlation between the proportion of Portuguese and percentage of females with a disability in the United States with a correlation coefficient (R) of 0.078 and weighted average of 13.0%. Similarly, the statistical analysis conducted on geographies consisting of 239,683,022 people shows a substantial positive correlation between the proportion of Immigrants from Spain and percentage of females with a disability in the United States with a correlation coefficient (R) of 0.523 and weighted average of 11.4%, a difference of 13.8%.
Female Disability Correlation Summary
| Measurement | Portuguese | Immigrants from Spain |
| Minimum | 5.0% | 0.40% |
| Maximum | 32.3% | 51.8% |
| Range | 27.3% | 51.4% |
| Mean | 14.6% | 13.4% |
| Median | 13.9% | 11.4% |
| Interquartile 25% (IQ1) | 12.1% | 8.8% |
| Interquartile 75% (IQ3) | 16.6% | 17.1% |
| Interquartile Range (IQR) | 4.5% | 8.2% |
| Standard Deviation (Sample) | 4.1% | 8.5% |
| Standard Deviation (Population) | 4.1% | 8.5% |
Similar Demographics by Female Disability
Demographics Similar to Portuguese by Female Disability
In terms of female disability, the demographic groups most similar to Portuguese are Cheyenne (13.0%, a difference of 0.050%), Immigrants from Dominica (13.0%, a difference of 0.10%), Sioux (12.9%, a difference of 0.12%), German (12.9%, a difference of 0.14%), and Spanish (13.0%, a difference of 0.31%).
| Demographics | Rating | Rank | Female Disability |
| Senegalese | 0.4 /100 | #267 | Tragic 12.8% |
| Immigrants | Laos | 0.4 /100 | #268 | Tragic 12.8% |
| Indonesians | 0.4 /100 | #269 | Tragic 12.8% |
| Immigrants | Liberia | 0.3 /100 | #270 | Tragic 12.9% |
| Dutch | 0.2 /100 | #271 | Tragic 12.9% |
| Germans | 0.1 /100 | #272 | Tragic 12.9% |
| Sioux | 0.1 /100 | #273 | Tragic 12.9% |
| Portuguese | 0.1 /100 | #274 | Tragic 13.0% |
| Cheyenne | 0.1 /100 | #275 | Tragic 13.0% |
| Immigrants | Dominica | 0.1 /100 | #276 | Tragic 13.0% |
| Spanish | 0.1 /100 | #277 | Tragic 13.0% |
| Scottish | 0.1 /100 | #278 | Tragic 13.0% |
| Arapaho | 0.1 /100 | #279 | Tragic 13.0% |
| Irish | 0.1 /100 | #280 | Tragic 13.1% |
| U.S. Virgin Islanders | 0.1 /100 | #281 | Tragic 13.1% |
Demographics Similar to Immigrants from Spain by Female Disability
In terms of female disability, the demographic groups most similar to Immigrants from Spain are Immigrants from Bulgaria (11.4%, a difference of 0.11%), Laotian (11.4%, a difference of 0.13%), South American (11.4%, a difference of 0.15%), Immigrants from France (11.4%, a difference of 0.17%), and Taiwanese (11.4%, a difference of 0.23%).
| Demographics | Rating | Rank | Female Disability |
| Immigrants | Peru | 99.9 /100 | #52 | Exceptional 11.3% |
| Immigrants | Saudi Arabia | 99.9 /100 | #53 | Exceptional 11.3% |
| Peruvians | 99.9 /100 | #54 | Exceptional 11.3% |
| Bulgarians | 99.9 /100 | #55 | Exceptional 11.3% |
| Taiwanese | 99.9 /100 | #56 | Exceptional 11.4% |
| South Americans | 99.9 /100 | #57 | Exceptional 11.4% |
| Laotians | 99.9 /100 | #58 | Exceptional 11.4% |
| Immigrants | Spain | 99.9 /100 | #59 | Exceptional 11.4% |
| Immigrants | Bulgaria | 99.9 /100 | #60 | Exceptional 11.4% |
| Immigrants | France | 99.9 /100 | #61 | Exceptional 11.4% |
| Sri Lankans | 99.9 /100 | #62 | Exceptional 11.4% |
| Immigrants | Colombia | 99.9 /100 | #63 | Exceptional 11.4% |
| Immigrants | El Salvador | 99.9 /100 | #64 | Exceptional 11.4% |
| Immigrants | South America | 99.9 /100 | #65 | Exceptional 11.4% |
| Salvadorans | 99.8 /100 | #66 | Exceptional 11.5% |