Paraguayan vs Immigrants from Spain Female Disability
COMPARE
Paraguayan
Immigrants from Spain
Female Disability
Female Disability Comparison
Paraguayans
Immigrants from Spain
11.2%
FEMALE DISABILITY
100.0/ 100
METRIC RATING
41st/ 347
METRIC RANK
11.4%
FEMALE DISABILITY
99.9/ 100
METRIC RATING
59th/ 347
METRIC RANK
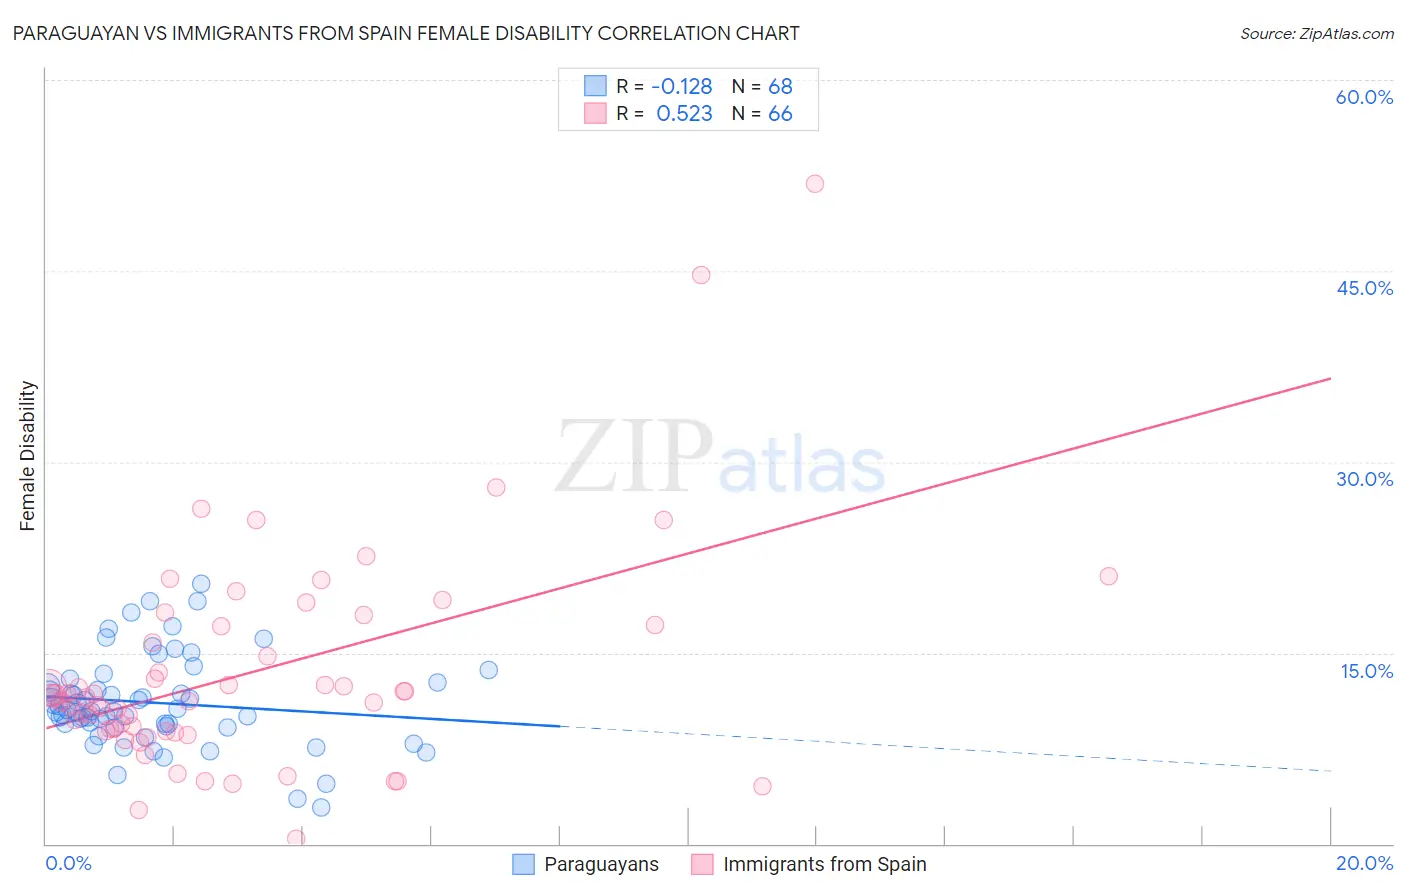
Paraguayan vs Immigrants from Spain Female Disability Correlation Chart
The statistical analysis conducted on geographies consisting of 95,112,364 people shows a poor negative correlation between the proportion of Paraguayans and percentage of females with a disability in the United States with a correlation coefficient (R) of -0.128 and weighted average of 11.2%. Similarly, the statistical analysis conducted on geographies consisting of 239,683,022 people shows a substantial positive correlation between the proportion of Immigrants from Spain and percentage of females with a disability in the United States with a correlation coefficient (R) of 0.523 and weighted average of 11.4%, a difference of 1.5%.
Female Disability Correlation Summary
| Measurement | Paraguayan | Immigrants from Spain |
| Minimum | 2.8% | 0.40% |
| Maximum | 20.4% | 51.8% |
| Range | 17.6% | 51.4% |
| Mean | 11.1% | 13.4% |
| Median | 10.5% | 11.4% |
| Interquartile 25% (IQ1) | 9.3% | 8.8% |
| Interquartile 75% (IQ3) | 12.5% | 17.1% |
| Interquartile Range (IQR) | 3.2% | 8.2% |
| Standard Deviation (Sample) | 3.5% | 8.5% |
| Standard Deviation (Population) | 3.5% | 8.5% |
Demographics Similar to Paraguayans and Immigrants from Spain by Female Disability
In terms of female disability, the demographic groups most similar to Paraguayans are Mongolian (11.2%, a difference of 0.020%), Israeli (11.2%, a difference of 0.10%), Afghan (11.2%, a difference of 0.12%), Cambodian (11.3%, a difference of 0.32%), and Immigrants from Sweden (11.3%, a difference of 0.36%). Similarly, the demographic groups most similar to Immigrants from Spain are Immigrants from Bulgaria (11.4%, a difference of 0.11%), Laotian (11.4%, a difference of 0.13%), South American (11.4%, a difference of 0.15%), Taiwanese (11.4%, a difference of 0.23%), and Bulgarian (11.3%, a difference of 0.46%).
| Demographics | Rating | Rank | Female Disability |
| Mongolians | 100.0 /100 | #40 | Exceptional 11.2% |
| Paraguayans | 100.0 /100 | #41 | Exceptional 11.2% |
| Israelis | 100.0 /100 | #42 | Exceptional 11.2% |
| Afghans | 100.0 /100 | #43 | Exceptional 11.2% |
| Cambodians | 100.0 /100 | #44 | Exceptional 11.3% |
| Immigrants | Sweden | 100.0 /100 | #45 | Exceptional 11.3% |
| Immigrants | Nepal | 100.0 /100 | #46 | Exceptional 11.3% |
| Jordanians | 100.0 /100 | #47 | Exceptional 11.3% |
| Zimbabweans | 100.0 /100 | #48 | Exceptional 11.3% |
| Tongans | 100.0 /100 | #49 | Exceptional 11.3% |
| Inupiat | 100.0 /100 | #50 | Exceptional 11.3% |
| Immigrants | Belgium | 100.0 /100 | #51 | Exceptional 11.3% |
| Immigrants | Peru | 99.9 /100 | #52 | Exceptional 11.3% |
| Immigrants | Saudi Arabia | 99.9 /100 | #53 | Exceptional 11.3% |
| Peruvians | 99.9 /100 | #54 | Exceptional 11.3% |
| Bulgarians | 99.9 /100 | #55 | Exceptional 11.3% |
| Taiwanese | 99.9 /100 | #56 | Exceptional 11.4% |
| South Americans | 99.9 /100 | #57 | Exceptional 11.4% |
| Laotians | 99.9 /100 | #58 | Exceptional 11.4% |
| Immigrants | Spain | 99.9 /100 | #59 | Exceptional 11.4% |
| Immigrants | Bulgaria | 99.9 /100 | #60 | Exceptional 11.4% |