Nepalese vs Immigrants from Central America Ambulatory Disability
COMPARE
Nepalese
Immigrants from Central America
Ambulatory Disability
Ambulatory Disability Comparison
Nepalese
Immigrants from Central America
6.6%
AMBULATORY DISABILITY
0.2/ 100
METRIC RATING
264th/ 347
METRIC RANK
6.2%
AMBULATORY DISABILITY
20.1/ 100
METRIC RATING
201st/ 347
METRIC RANK
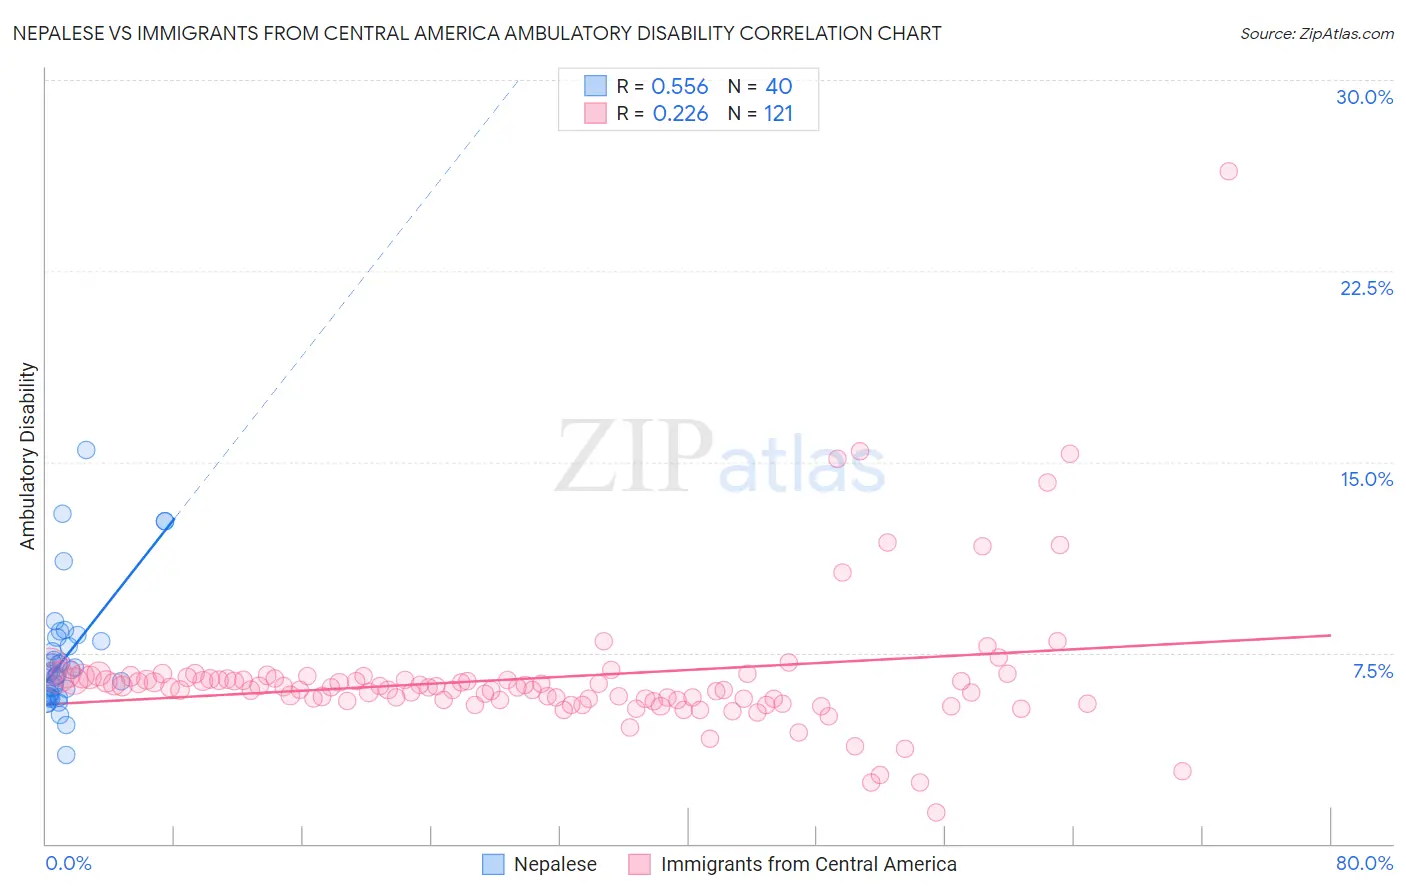
Nepalese vs Immigrants from Central America Ambulatory Disability Correlation Chart
The statistical analysis conducted on geographies consisting of 24,521,755 people shows a substantial positive correlation between the proportion of Nepalese and percentage of population with ambulatory disability in the United States with a correlation coefficient (R) of 0.556 and weighted average of 6.6%. Similarly, the statistical analysis conducted on geographies consisting of 536,120,353 people shows a weak positive correlation between the proportion of Immigrants from Central America and percentage of population with ambulatory disability in the United States with a correlation coefficient (R) of 0.226 and weighted average of 6.2%, a difference of 6.1%.
Ambulatory Disability Correlation Summary
| Measurement | Nepalese | Immigrants from Central America |
| Minimum | 3.5% | 1.2% |
| Maximum | 15.5% | 26.4% |
| Range | 12.0% | 25.2% |
| Mean | 7.4% | 6.5% |
| Median | 6.7% | 6.2% |
| Interquartile 25% (IQ1) | 5.9% | 5.7% |
| Interquartile 75% (IQ3) | 8.0% | 6.5% |
| Interquartile Range (IQR) | 2.2% | 0.85% |
| Standard Deviation (Sample) | 2.4% | 2.8% |
| Standard Deviation (Population) | 2.4% | 2.8% |
Similar Demographics by Ambulatory Disability
Demographics Similar to Nepalese by Ambulatory Disability
In terms of ambulatory disability, the demographic groups most similar to Nepalese are Bahamian (6.6%, a difference of 0.060%), Guyanese (6.6%, a difference of 0.18%), Trinidadian and Tobagonian (6.6%, a difference of 0.31%), Spanish (6.6%, a difference of 0.33%), and Hmong (6.6%, a difference of 0.40%).
| Demographics | Rating | Rank | Ambulatory Disability |
| Bermudans | 0.5 /100 | #257 | Tragic 6.5% |
| Spanish American Indians | 0.5 /100 | #258 | Tragic 6.5% |
| Aleuts | 0.4 /100 | #259 | Tragic 6.6% |
| Immigrants | Belize | 0.4 /100 | #260 | Tragic 6.6% |
| Irish | 0.4 /100 | #261 | Tragic 6.6% |
| English | 0.4 /100 | #262 | Tragic 6.6% |
| Hmong | 0.3 /100 | #263 | Tragic 6.6% |
| Nepalese | 0.2 /100 | #264 | Tragic 6.6% |
| Bahamians | 0.2 /100 | #265 | Tragic 6.6% |
| Guyanese | 0.2 /100 | #266 | Tragic 6.6% |
| Trinidadians and Tobagonians | 0.2 /100 | #267 | Tragic 6.6% |
| Spanish | 0.2 /100 | #268 | Tragic 6.6% |
| French | 0.1 /100 | #269 | Tragic 6.6% |
| Slovaks | 0.1 /100 | #270 | Tragic 6.7% |
| Immigrants | Trinidad and Tobago | 0.1 /100 | #271 | Tragic 6.7% |
Demographics Similar to Immigrants from Central America by Ambulatory Disability
In terms of ambulatory disability, the demographic groups most similar to Immigrants from Central America are Albanian (6.2%, a difference of 0.030%), Immigrants from Cambodia (6.2%, a difference of 0.11%), Immigrants from Ukraine (6.2%, a difference of 0.14%), Immigrants from Congo (6.2%, a difference of 0.15%), and Slovene (6.2%, a difference of 0.17%).
| Demographics | Rating | Rank | Ambulatory Disability |
| Alaska Natives | 29.8 /100 | #194 | Fair 6.2% |
| Belgians | 28.6 /100 | #195 | Fair 6.2% |
| Malaysians | 28.2 /100 | #196 | Fair 6.2% |
| Poles | 26.3 /100 | #197 | Fair 6.2% |
| Immigrants | Bangladesh | 24.6 /100 | #198 | Fair 6.2% |
| Italians | 22.6 /100 | #199 | Fair 6.2% |
| Immigrants | Cambodia | 21.5 /100 | #200 | Fair 6.2% |
| Immigrants | Central America | 20.1 /100 | #201 | Fair 6.2% |
| Albanians | 19.7 /100 | #202 | Poor 6.2% |
| Immigrants | Ukraine | 18.4 /100 | #203 | Poor 6.2% |
| Immigrants | Congo | 18.2 /100 | #204 | Poor 6.2% |
| Slovenes | 18.0 /100 | #205 | Poor 6.2% |
| Finns | 17.2 /100 | #206 | Poor 6.2% |
| Alsatians | 15.1 /100 | #207 | Poor 6.3% |
| Bangladeshis | 14.2 /100 | #208 | Poor 6.3% |