Iroquois vs Immigrants from Central America Ambulatory Disability
COMPARE
Iroquois
Immigrants from Central America
Ambulatory Disability
Ambulatory Disability Comparison
Iroquois
Immigrants from Central America
7.1%
AMBULATORY DISABILITY
0.0/ 100
METRIC RATING
306th/ 347
METRIC RANK
6.2%
AMBULATORY DISABILITY
20.1/ 100
METRIC RATING
201st/ 347
METRIC RANK
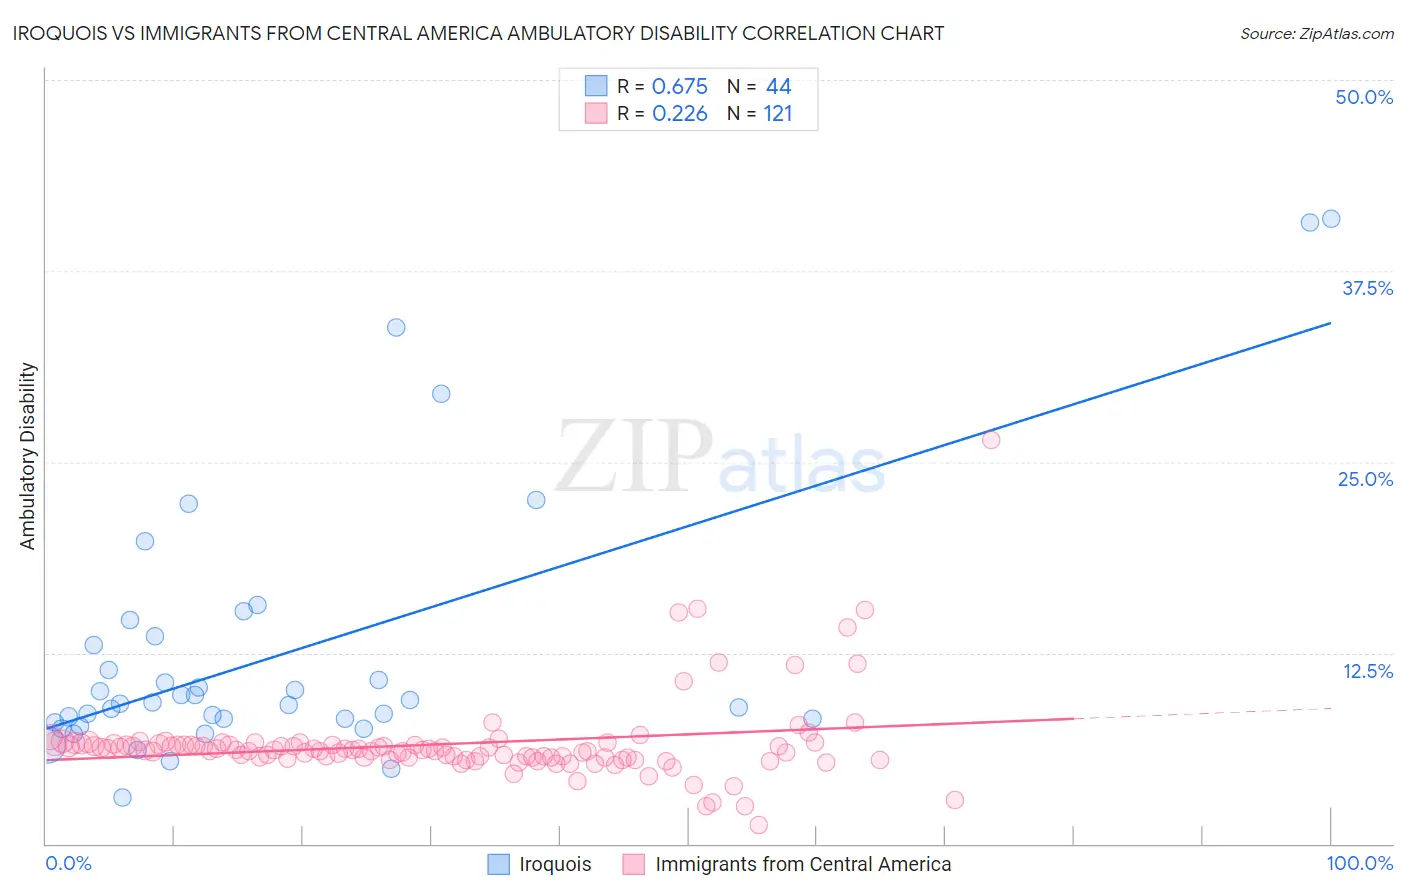
Iroquois vs Immigrants from Central America Ambulatory Disability Correlation Chart
The statistical analysis conducted on geographies consisting of 207,272,935 people shows a significant positive correlation between the proportion of Iroquois and percentage of population with ambulatory disability in the United States with a correlation coefficient (R) of 0.675 and weighted average of 7.1%. Similarly, the statistical analysis conducted on geographies consisting of 536,120,353 people shows a weak positive correlation between the proportion of Immigrants from Central America and percentage of population with ambulatory disability in the United States with a correlation coefficient (R) of 0.226 and weighted average of 6.2%, a difference of 13.2%.
Ambulatory Disability Correlation Summary
| Measurement | Iroquois | Immigrants from Central America |
| Minimum | 3.0% | 1.2% |
| Maximum | 40.9% | 26.4% |
| Range | 37.9% | 25.2% |
| Mean | 12.5% | 6.5% |
| Median | 9.2% | 6.2% |
| Interquartile 25% (IQ1) | 8.0% | 5.7% |
| Interquartile 75% (IQ3) | 13.3% | 6.5% |
| Interquartile Range (IQR) | 5.2% | 0.85% |
| Standard Deviation (Sample) | 8.7% | 2.8% |
| Standard Deviation (Population) | 8.6% | 2.8% |
Similar Demographics by Ambulatory Disability
Demographics Similar to Iroquois by Ambulatory Disability
In terms of ambulatory disability, the demographic groups most similar to Iroquois are Spanish American (7.1%, a difference of 0.26%), Chippewa (7.1%, a difference of 0.27%), Immigrants from the Azores (7.1%, a difference of 0.44%), Immigrants from Micronesia (7.0%, a difference of 0.53%), and Arapaho (7.1%, a difference of 0.72%).
| Demographics | Rating | Rank | Ambulatory Disability |
| Puget Sound Salish | 0.0 /100 | #299 | Tragic 6.9% |
| Marshallese | 0.0 /100 | #300 | Tragic 6.9% |
| British West Indians | 0.0 /100 | #301 | Tragic 7.0% |
| Immigrants | Armenia | 0.0 /100 | #302 | Tragic 7.0% |
| Africans | 0.0 /100 | #303 | Tragic 7.0% |
| Immigrants | Cabo Verde | 0.0 /100 | #304 | Tragic 7.0% |
| Immigrants | Micronesia | 0.0 /100 | #305 | Tragic 7.0% |
| Iroquois | 0.0 /100 | #306 | Tragic 7.1% |
| Spanish Americans | 0.0 /100 | #307 | Tragic 7.1% |
| Chippewa | 0.0 /100 | #308 | Tragic 7.1% |
| Immigrants | Azores | 0.0 /100 | #309 | Tragic 7.1% |
| Arapaho | 0.0 /100 | #310 | Tragic 7.1% |
| Cree | 0.0 /100 | #311 | Tragic 7.1% |
| Delaware | 0.0 /100 | #312 | Tragic 7.1% |
| Immigrants | Yemen | 0.0 /100 | #313 | Tragic 7.1% |
Demographics Similar to Immigrants from Central America by Ambulatory Disability
In terms of ambulatory disability, the demographic groups most similar to Immigrants from Central America are Albanian (6.2%, a difference of 0.030%), Immigrants from Cambodia (6.2%, a difference of 0.11%), Immigrants from Ukraine (6.2%, a difference of 0.14%), Immigrants from Congo (6.2%, a difference of 0.15%), and Slovene (6.2%, a difference of 0.17%).
| Demographics | Rating | Rank | Ambulatory Disability |
| Alaska Natives | 29.8 /100 | #194 | Fair 6.2% |
| Belgians | 28.6 /100 | #195 | Fair 6.2% |
| Malaysians | 28.2 /100 | #196 | Fair 6.2% |
| Poles | 26.3 /100 | #197 | Fair 6.2% |
| Immigrants | Bangladesh | 24.6 /100 | #198 | Fair 6.2% |
| Italians | 22.6 /100 | #199 | Fair 6.2% |
| Immigrants | Cambodia | 21.5 /100 | #200 | Fair 6.2% |
| Immigrants | Central America | 20.1 /100 | #201 | Fair 6.2% |
| Albanians | 19.7 /100 | #202 | Poor 6.2% |
| Immigrants | Ukraine | 18.4 /100 | #203 | Poor 6.2% |
| Immigrants | Congo | 18.2 /100 | #204 | Poor 6.2% |
| Slovenes | 18.0 /100 | #205 | Poor 6.2% |
| Finns | 17.2 /100 | #206 | Poor 6.2% |
| Alsatians | 15.1 /100 | #207 | Poor 6.3% |
| Bangladeshis | 14.2 /100 | #208 | Poor 6.3% |