Native/Alaskan vs Indian (Asian) Female Disability
COMPARE
Native/Alaskan
Indian (Asian)
Female Disability
Female Disability Comparison
Natives/Alaskans
Indians (Asian)
14.1%
FEMALE DISABILITY
0.0/ 100
METRIC RATING
324th/ 347
METRIC RANK
10.8%
FEMALE DISABILITY
100.0/ 100
METRIC RATING
17th/ 347
METRIC RANK
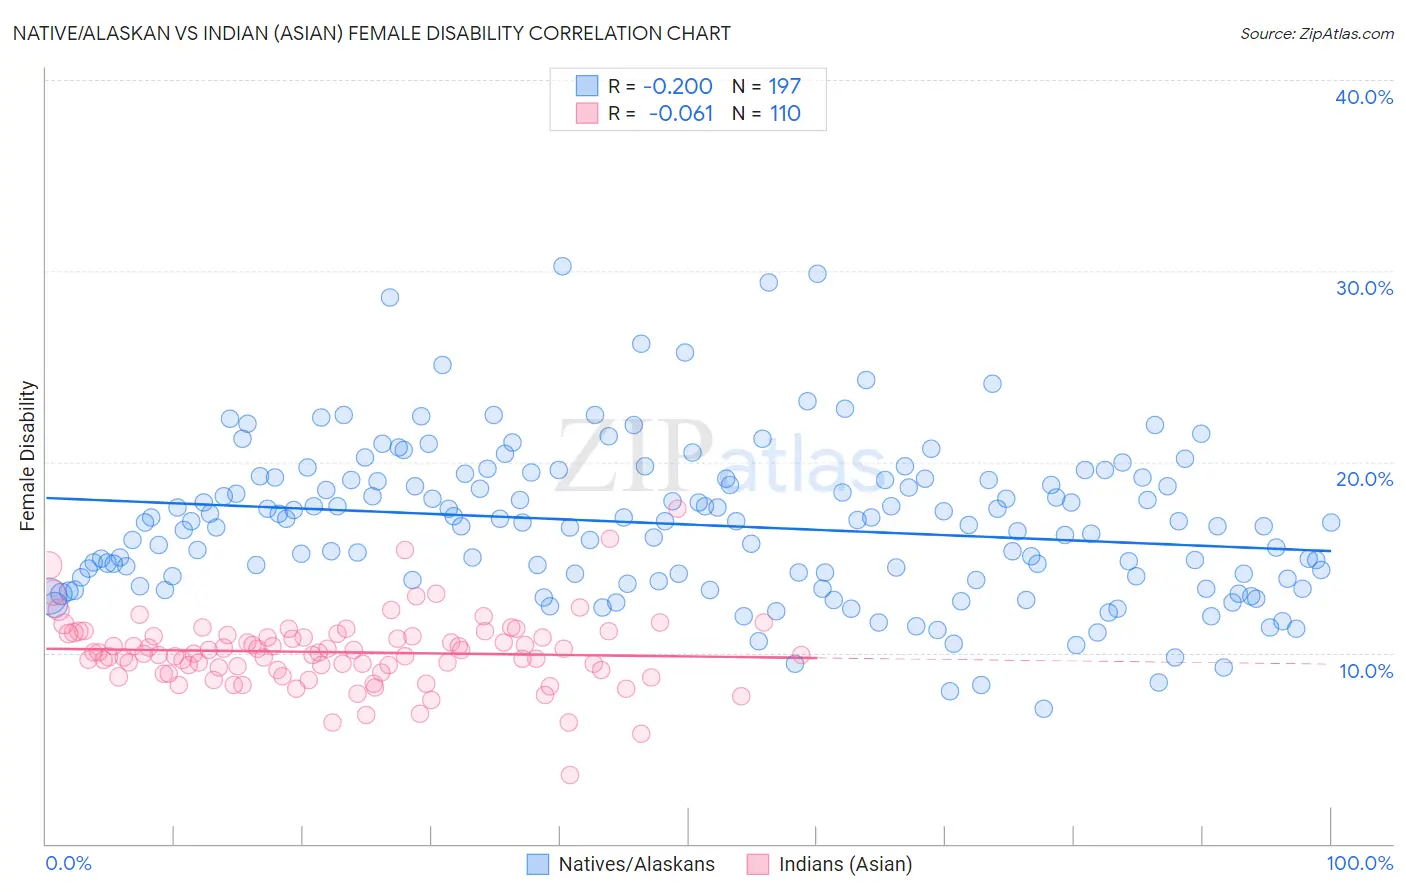
Native/Alaskan vs Indian (Asian) Female Disability Correlation Chart
The statistical analysis conducted on geographies consisting of 512,836,768 people shows a weak negative correlation between the proportion of Natives/Alaskans and percentage of females with a disability in the United States with a correlation coefficient (R) of -0.200 and weighted average of 14.1%. Similarly, the statistical analysis conducted on geographies consisting of 495,223,198 people shows a slight negative correlation between the proportion of Indians (Asian) and percentage of females with a disability in the United States with a correlation coefficient (R) of -0.061 and weighted average of 10.8%, a difference of 31.1%.
Female Disability Correlation Summary
| Measurement | Native/Alaskan | Indian (Asian) |
| Minimum | 7.0% | 3.6% |
| Maximum | 30.2% | 17.5% |
| Range | 23.2% | 13.9% |
| Mean | 16.7% | 10.0% |
| Median | 16.8% | 10.0% |
| Interquartile 25% (IQ1) | 13.9% | 9.1% |
| Interquartile 75% (IQ3) | 19.1% | 10.9% |
| Interquartile Range (IQR) | 5.2% | 1.8% |
| Standard Deviation (Sample) | 4.0% | 1.9% |
| Standard Deviation (Population) | 4.0% | 1.9% |
Similar Demographics by Female Disability
Demographics Similar to Natives/Alaskans by Female Disability
In terms of female disability, the demographic groups most similar to Natives/Alaskans are Black/African American (14.1%, a difference of 0.020%), Navajo (14.2%, a difference of 0.14%), Pueblo (14.1%, a difference of 0.18%), Potawatomi (14.1%, a difference of 0.20%), and Comanche (14.2%, a difference of 0.25%).
| Demographics | Rating | Rank | Female Disability |
| Chippewa | 0.0 /100 | #317 | Tragic 14.0% |
| Paiute | 0.0 /100 | #318 | Tragic 14.0% |
| Iroquois | 0.0 /100 | #319 | Tragic 14.0% |
| Americans | 0.0 /100 | #320 | Tragic 14.1% |
| Potawatomi | 0.0 /100 | #321 | Tragic 14.1% |
| Pueblo | 0.0 /100 | #322 | Tragic 14.1% |
| Blacks/African Americans | 0.0 /100 | #323 | Tragic 14.1% |
| Natives/Alaskans | 0.0 /100 | #324 | Tragic 14.1% |
| Navajo | 0.0 /100 | #325 | Tragic 14.2% |
| Comanche | 0.0 /100 | #326 | Tragic 14.2% |
| Ottawa | 0.0 /100 | #327 | Tragic 14.2% |
| Cape Verdeans | 0.0 /100 | #328 | Tragic 14.2% |
| Osage | 0.0 /100 | #329 | Tragic 14.3% |
| Yuman | 0.0 /100 | #330 | Tragic 14.5% |
| Immigrants | Cabo Verde | 0.0 /100 | #331 | Tragic 14.6% |
Demographics Similar to Indians (Asian) by Female Disability
In terms of female disability, the demographic groups most similar to Indians (Asian) are Okinawan (10.8%, a difference of 0.32%), Immigrants from Iran (10.8%, a difference of 0.38%), Burmese (10.7%, a difference of 0.39%), Immigrants from Venezuela (10.9%, a difference of 0.60%), and Immigrants from Pakistan (10.9%, a difference of 0.77%).
| Demographics | Rating | Rank | Female Disability |
| Immigrants | Hong Kong | 100.0 /100 | #10 | Exceptional 10.6% |
| Immigrants | Korea | 100.0 /100 | #11 | Exceptional 10.6% |
| Immigrants | Israel | 100.0 /100 | #12 | Exceptional 10.7% |
| Immigrants | Eastern Asia | 100.0 /100 | #13 | Exceptional 10.7% |
| Immigrants | China | 100.0 /100 | #14 | Exceptional 10.7% |
| Burmese | 100.0 /100 | #15 | Exceptional 10.7% |
| Okinawans | 100.0 /100 | #16 | Exceptional 10.8% |
| Indians (Asian) | 100.0 /100 | #17 | Exceptional 10.8% |
| Immigrants | Iran | 100.0 /100 | #18 | Exceptional 10.8% |
| Immigrants | Venezuela | 100.0 /100 | #19 | Exceptional 10.9% |
| Immigrants | Pakistan | 100.0 /100 | #20 | Exceptional 10.9% |
| Asians | 100.0 /100 | #21 | Exceptional 10.9% |
| Immigrants | Sri Lanka | 100.0 /100 | #22 | Exceptional 10.9% |
| Venezuelans | 100.0 /100 | #23 | Exceptional 11.0% |
| Immigrants | Argentina | 100.0 /100 | #24 | Exceptional 11.0% |