Mexican vs Mexican American Indian Male Disability
COMPARE
Mexican
Mexican American Indian
Male Disability
Male Disability Comparison
Mexicans
Mexican American Indians
11.8%
MALE DISABILITY
1.7/ 100
METRIC RATING
233rd/ 347
METRIC RANK
11.6%
MALE DISABILITY
7.8/ 100
METRIC RATING
213th/ 347
METRIC RANK
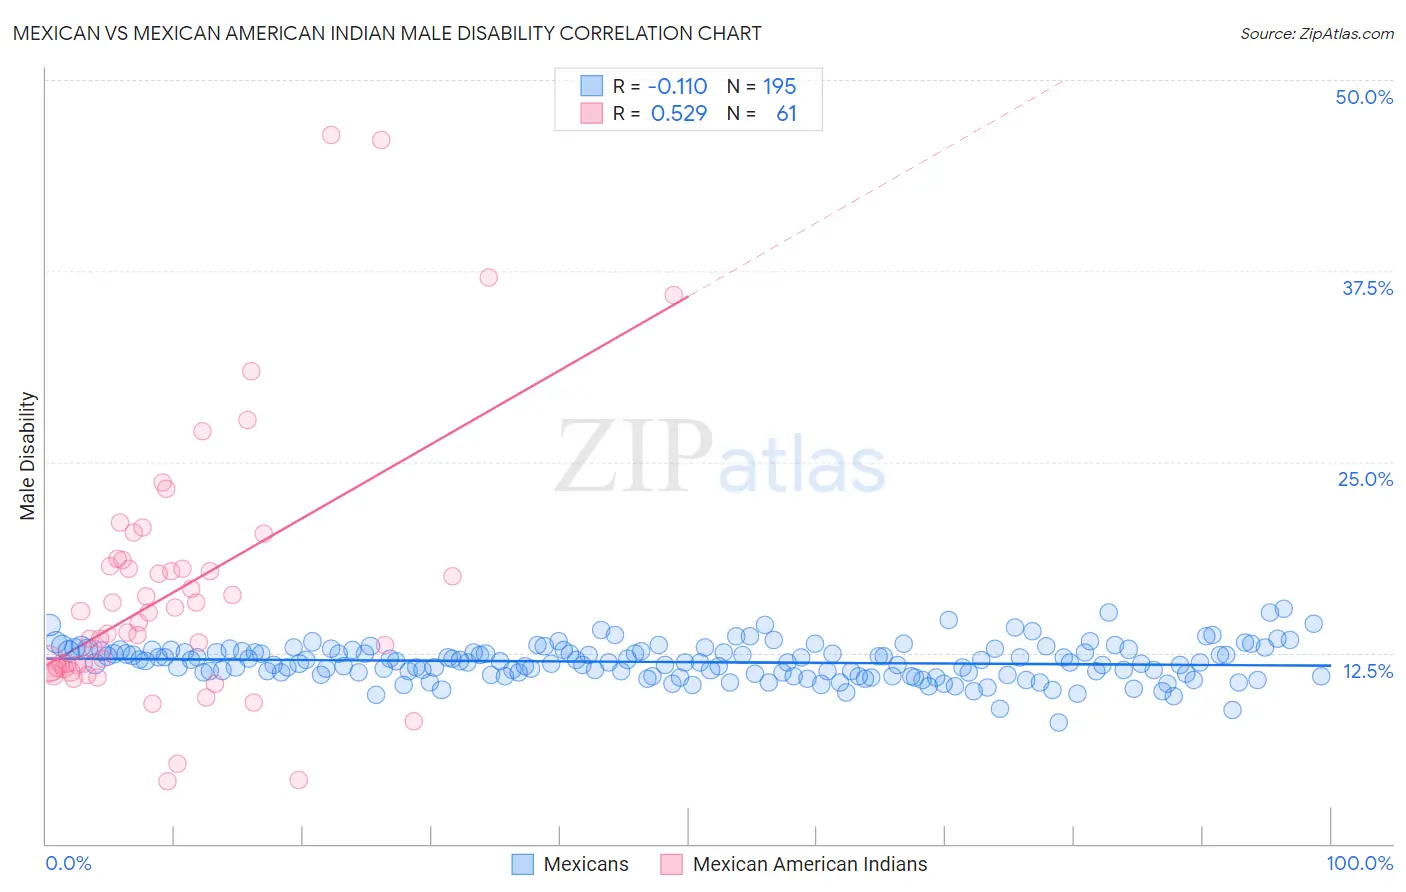
Mexican vs Mexican American Indian Male Disability Correlation Chart
The statistical analysis conducted on geographies consisting of 564,830,995 people shows a poor negative correlation between the proportion of Mexicans and percentage of males with a disability in the United States with a correlation coefficient (R) of -0.110 and weighted average of 11.8%. Similarly, the statistical analysis conducted on geographies consisting of 317,563,584 people shows a substantial positive correlation between the proportion of Mexican American Indians and percentage of males with a disability in the United States with a correlation coefficient (R) of 0.529 and weighted average of 11.6%, a difference of 2.1%.
Male Disability Correlation Summary
| Measurement | Mexican | Mexican American Indian |
| Minimum | 8.0% | 4.1% |
| Maximum | 15.4% | 46.4% |
| Range | 7.4% | 42.3% |
| Mean | 11.9% | 16.6% |
| Median | 11.9% | 14.5% |
| Interquartile 25% (IQ1) | 11.1% | 11.5% |
| Interquartile 75% (IQ3) | 12.6% | 18.4% |
| Interquartile Range (IQR) | 1.5% | 6.8% |
| Standard Deviation (Sample) | 1.2% | 8.5% |
| Standard Deviation (Population) | 1.2% | 8.4% |
Demographics Similar to Mexicans and Mexican American Indians by Male Disability
In terms of male disability, the demographic groups most similar to Mexicans are Malaysian (11.8%, a difference of 0.040%), Dominican (11.8%, a difference of 0.10%), Croatian (11.8%, a difference of 0.30%), Bermudan (11.8%, a difference of 0.38%), and Hispanic or Latino (11.8%, a difference of 0.42%). Similarly, the demographic groups most similar to Mexican American Indians are Lithuanian (11.6%, a difference of 0.24%), Indonesian (11.6%, a difference of 0.40%), Immigrants from Dominican Republic (11.7%, a difference of 0.68%), Immigrants from Dominica (11.7%, a difference of 0.75%), and Immigrants from England (11.7%, a difference of 0.96%).
| Demographics | Rating | Rank | Male Disability |
| Mexican American Indians | 7.8 /100 | #213 | Tragic 11.6% |
| Lithuanians | 6.6 /100 | #214 | Tragic 11.6% |
| Indonesians | 5.9 /100 | #215 | Tragic 11.6% |
| Immigrants | Dominican Republic | 4.9 /100 | #216 | Tragic 11.7% |
| Immigrants | Dominica | 4.6 /100 | #217 | Tragic 11.7% |
| Immigrants | England | 4.0 /100 | #218 | Tragic 11.7% |
| Panamanians | 3.8 /100 | #219 | Tragic 11.7% |
| Immigrants | Western Europe | 3.8 /100 | #220 | Tragic 11.7% |
| Immigrants | Congo | 3.7 /100 | #221 | Tragic 11.7% |
| Alsatians | 3.3 /100 | #222 | Tragic 11.7% |
| Immigrants | Bahamas | 3.2 /100 | #223 | Tragic 11.7% |
| Japanese | 3.1 /100 | #224 | Tragic 11.7% |
| Liberians | 3.1 /100 | #225 | Tragic 11.8% |
| Sub-Saharan Africans | 2.8 /100 | #226 | Tragic 11.8% |
| Austrians | 2.5 /100 | #227 | Tragic 11.8% |
| Hispanics or Latinos | 2.3 /100 | #228 | Tragic 11.8% |
| Bermudans | 2.3 /100 | #229 | Tragic 11.8% |
| Croatians | 2.1 /100 | #230 | Tragic 11.8% |
| Dominicans | 1.8 /100 | #231 | Tragic 11.8% |
| Malaysians | 1.8 /100 | #232 | Tragic 11.8% |
| Mexicans | 1.7 /100 | #233 | Tragic 11.8% |